Hello all,
I am trying to run a DGP study for a big area, with multiple Viewpoints. I was able to set everything up in LBT so that I can generate HDR images needed for the calculation. As an addition to the images I want to provide a graph and some visuals showing the suns visibility in those specific points during the year.
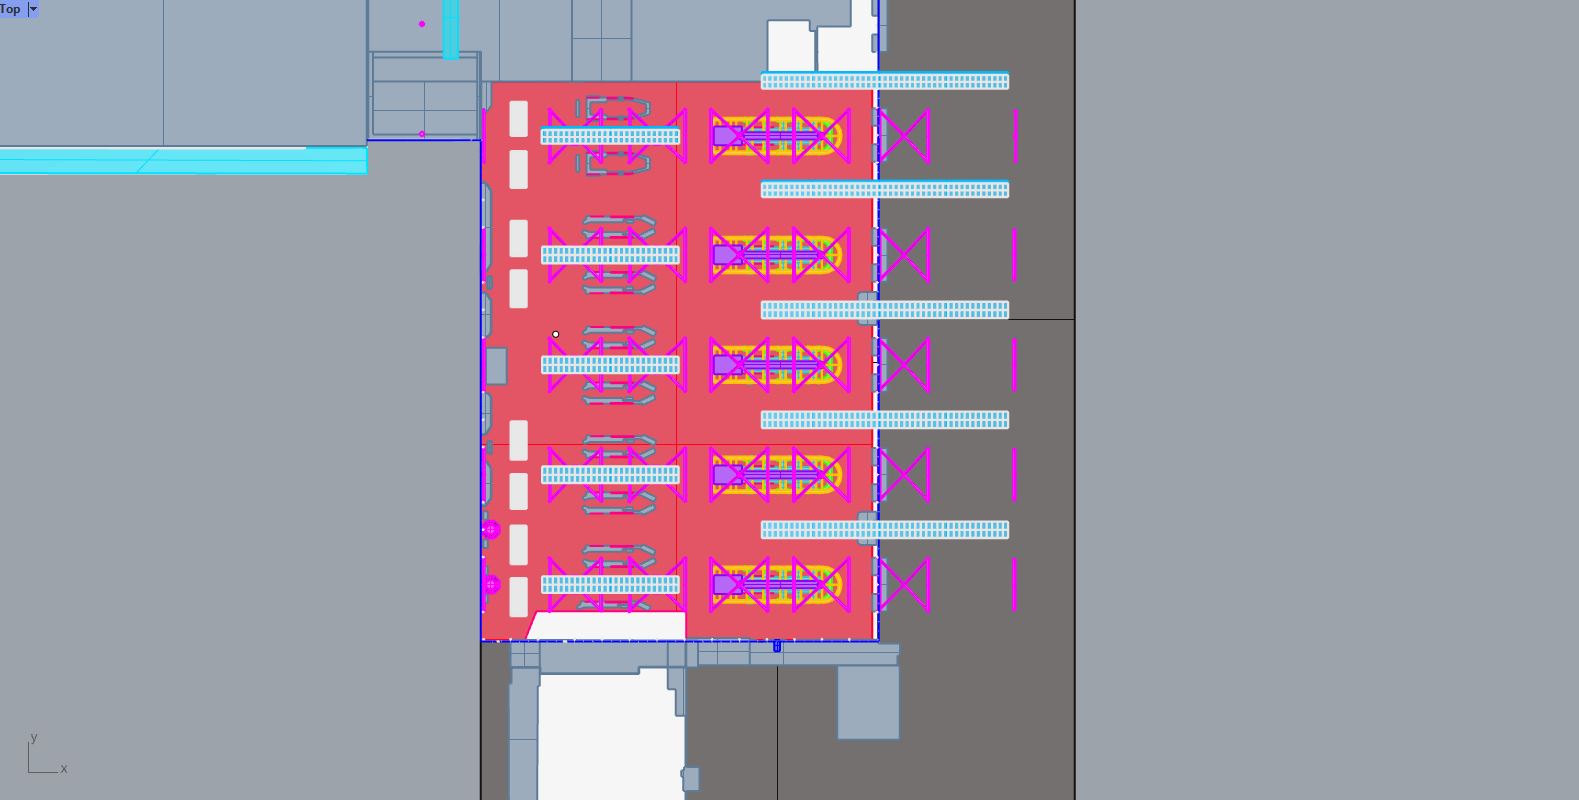
Several questions came up while I was trying to build up the recipe. I tried to do it with a smaller geometry and after all is clear, move on to the bigger model.
- Grid size
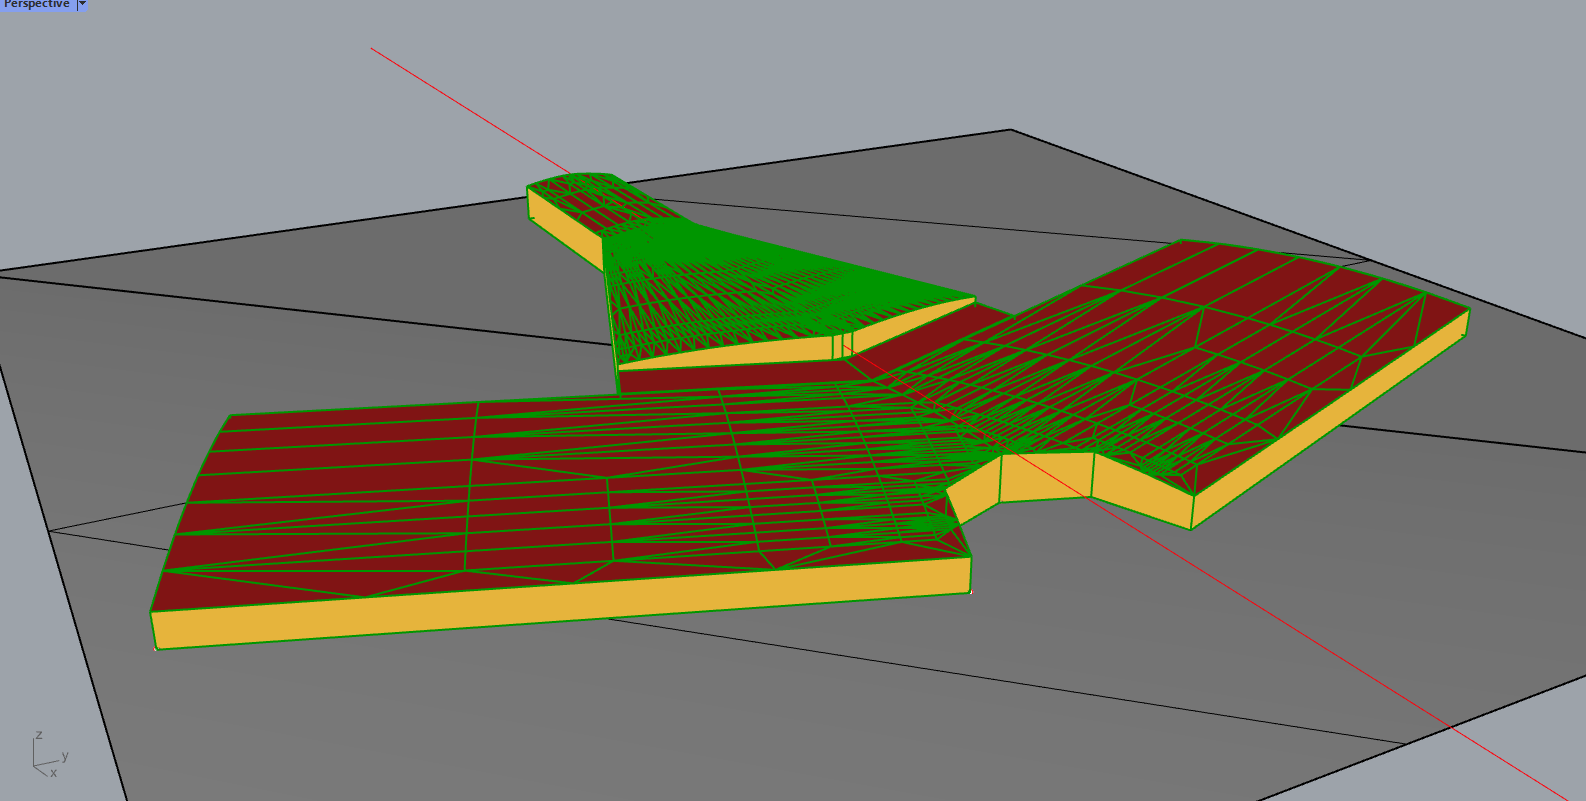
While working on my smaller model, I have made a small surface (100/100mm) linked to the geometry node on Direct sun hours. Right now I have a grid that only consist of one testing point. Does the grid size play any role in this calculation, and if so, what would be an appropriate size for the test surface for the bigger model?
2.Sun is Visible
I wanted to show the visible sun positions for every view point I had to test and show graphically the sun vectors. I tried to do it by culling the sun points with the results I get from the Direct Sun Hours component int_mtx.
After reading some old threads, I found a post saying the correct way was to use the sun vectors. Is this the way to go?
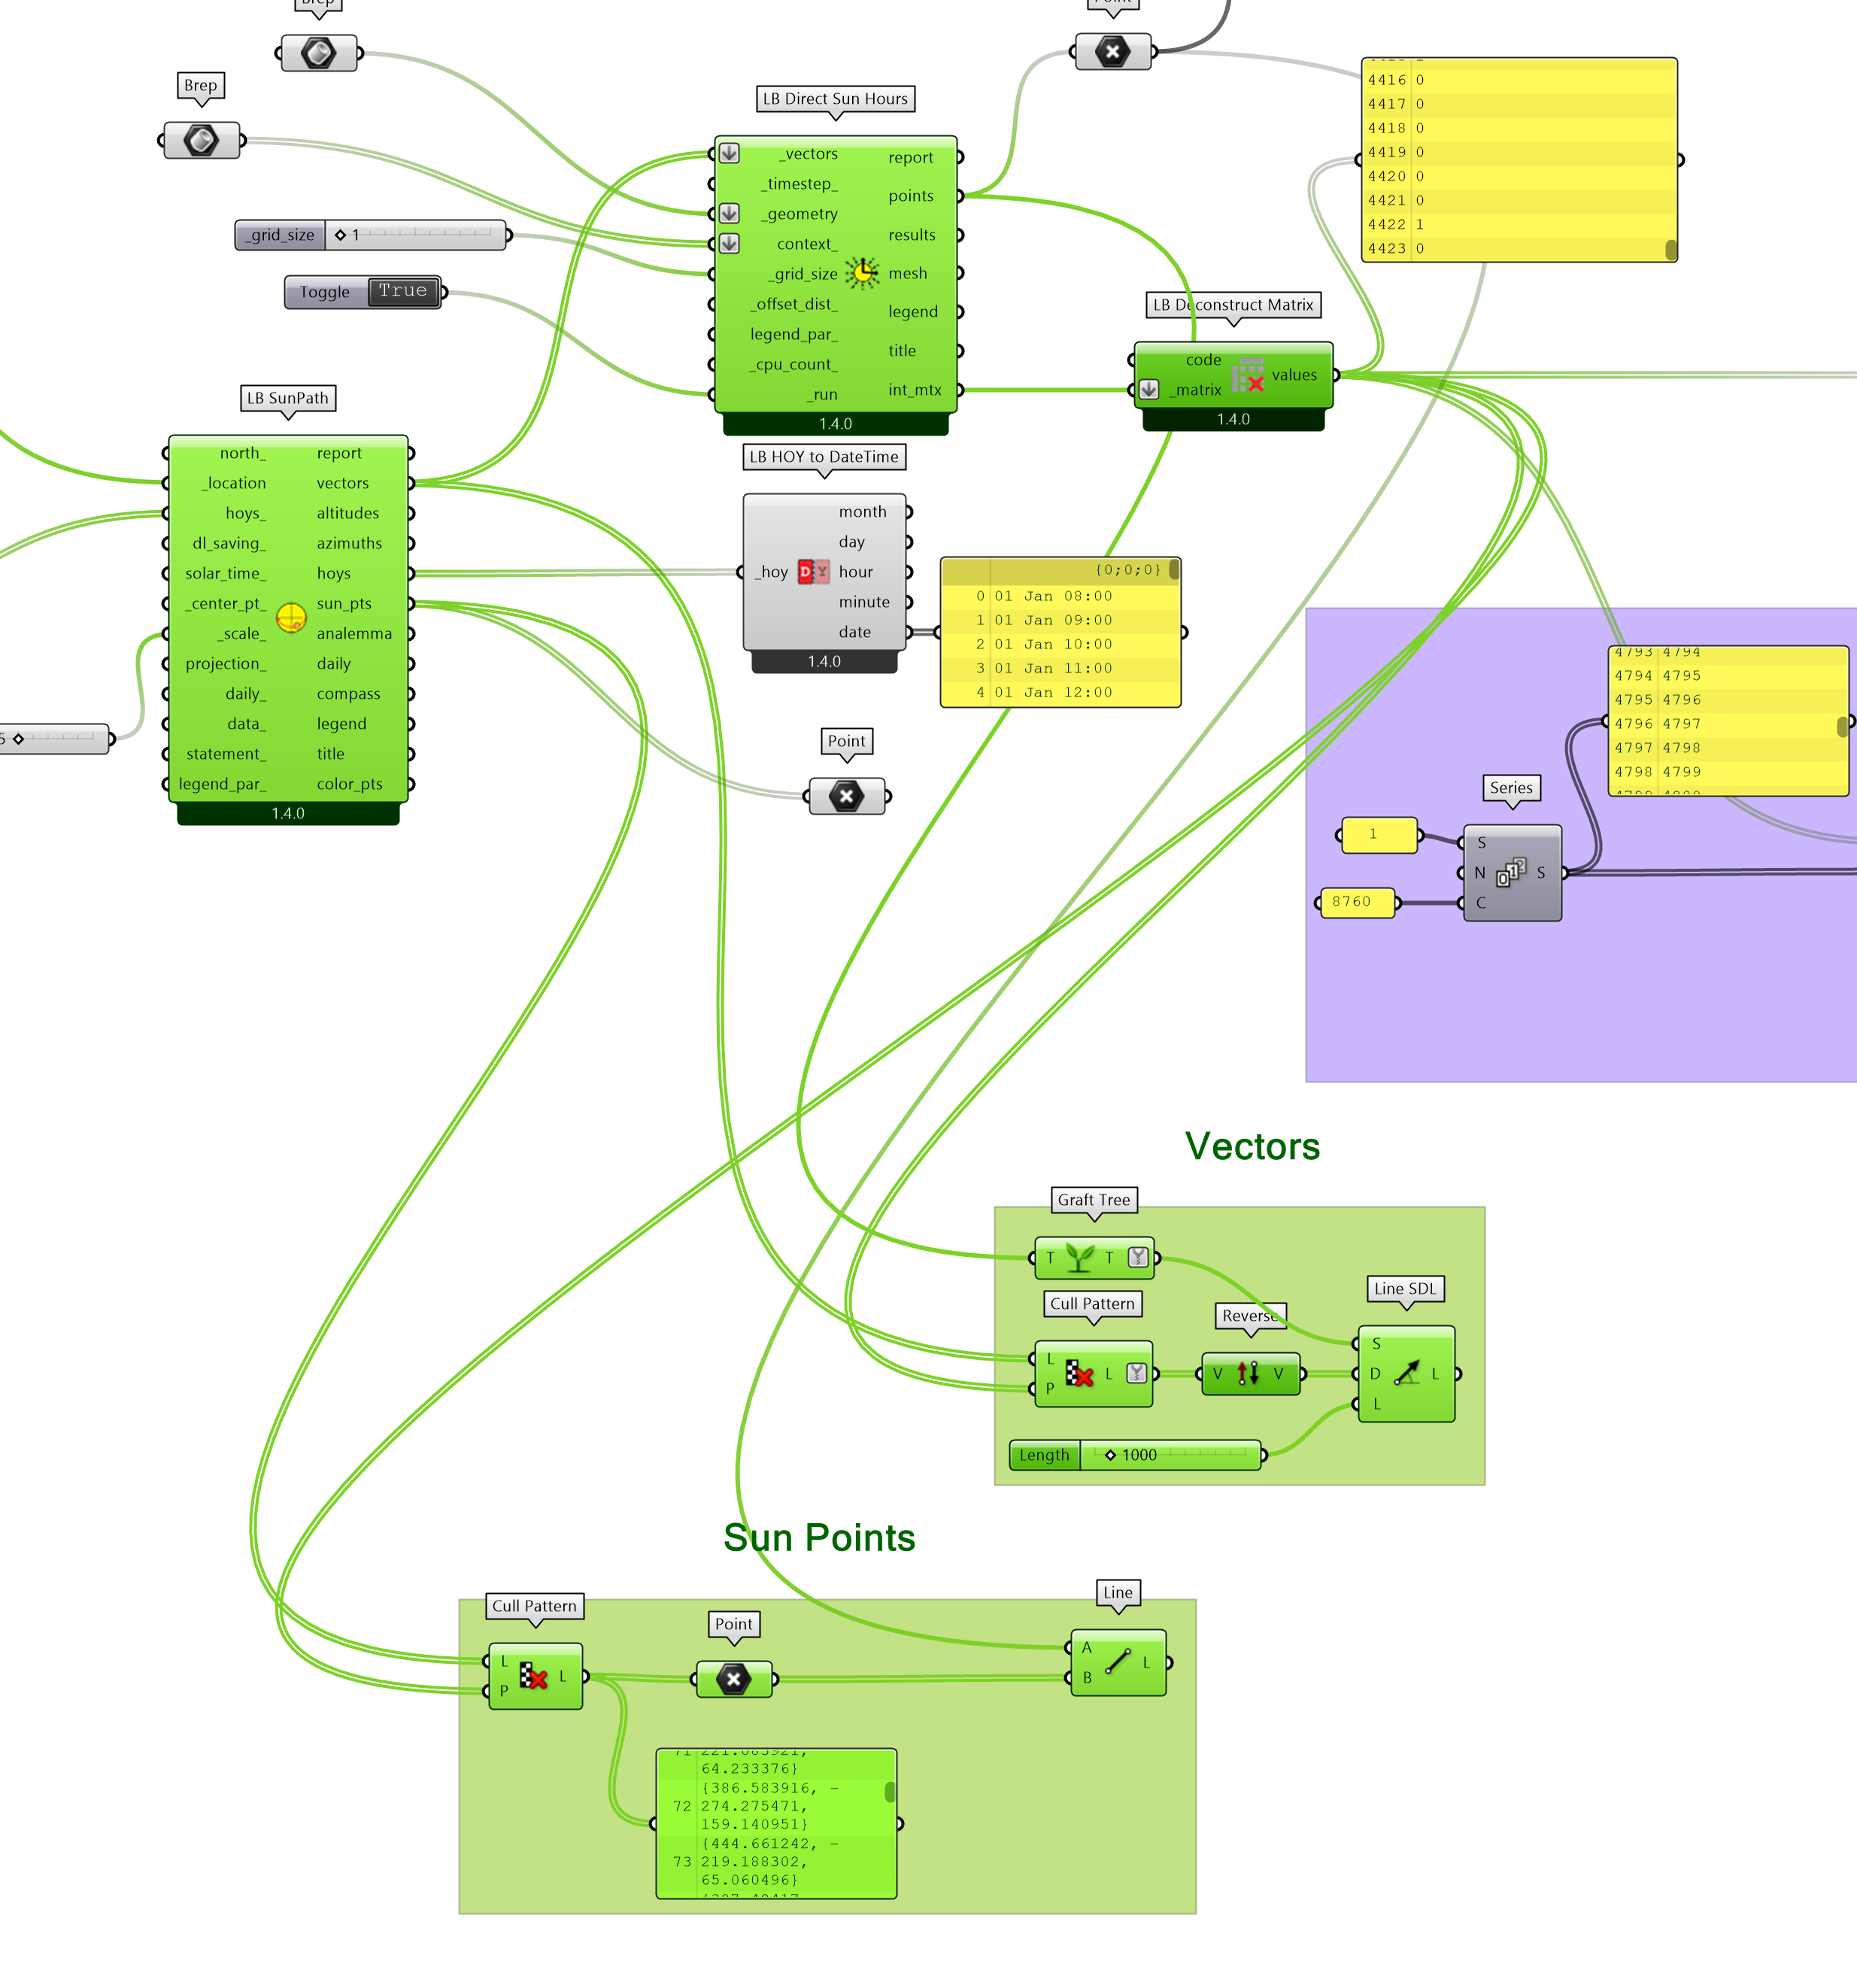
I get very different results from the two
Vectors:

Sun Points:

Also, having the test geometry facing south, I my opinion, I should get more hours where sun is visible(at least in my opinion).
- Data and Graph
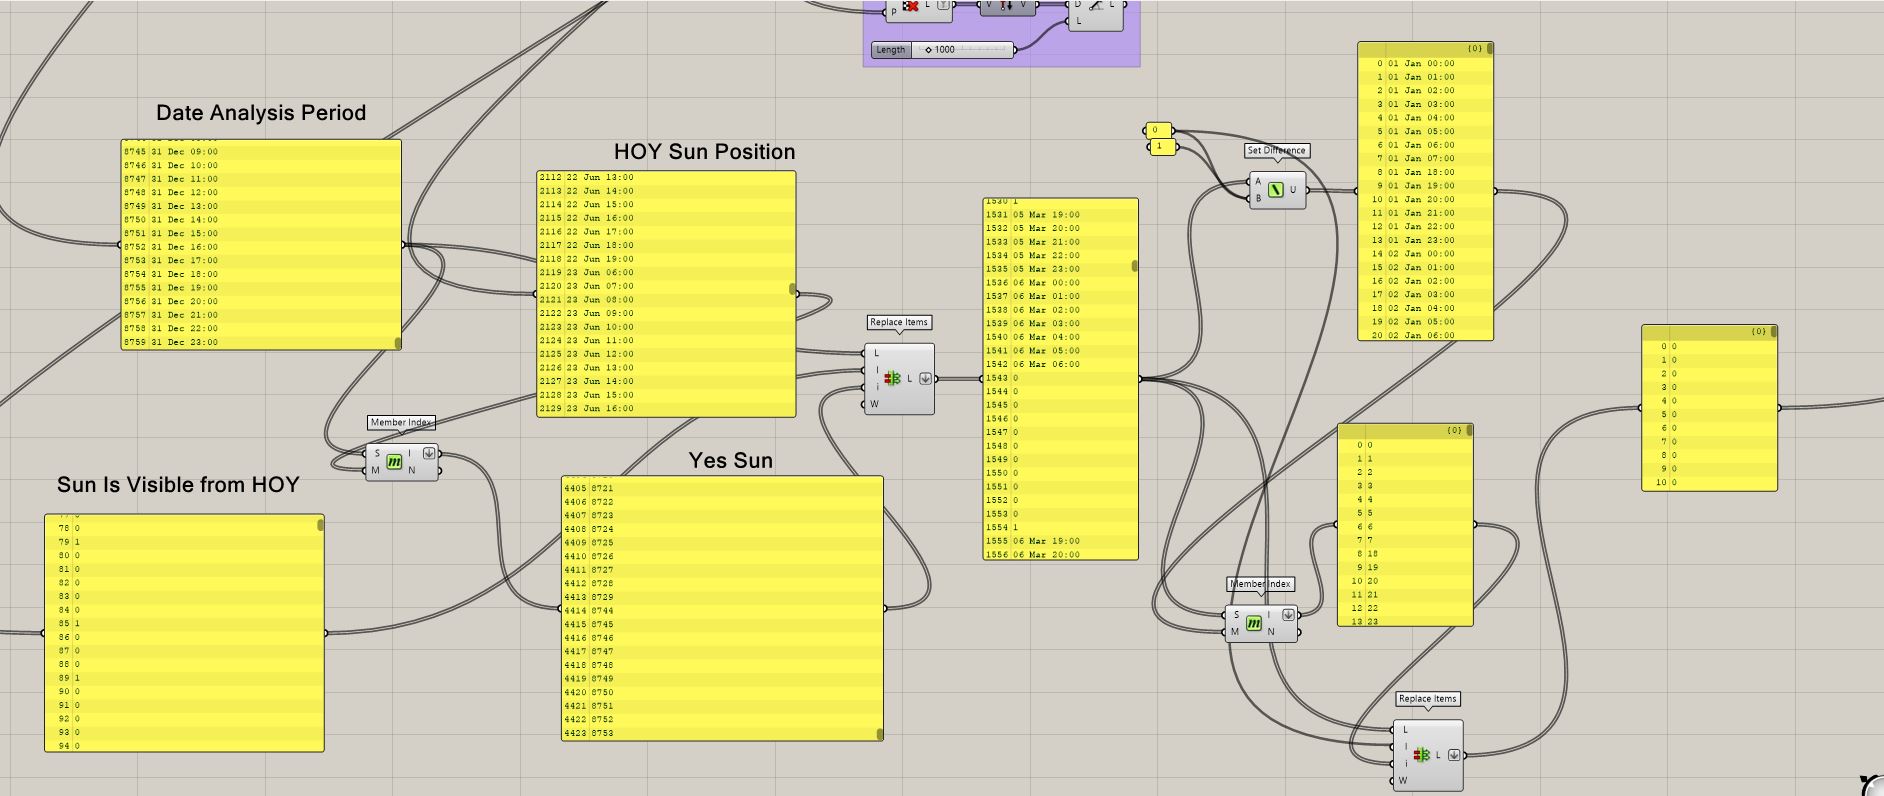
My intention is to do an yearly study, getting data for every hour of the year, meaning 8760 hours. As the sun is not always up, I get 4424 values from the int_mtx. At first , when connecting them to LB Hourly Plot I got an error message, and after watching and reading a bunch of problems online, I came to the conclusion(could be a wrong one!) that I needed 8760 values, true or false, that represent whether the sun is visible or not. I did that not knowing or understanding everything completely, but at the end I got a list of values that worked. This is the process:
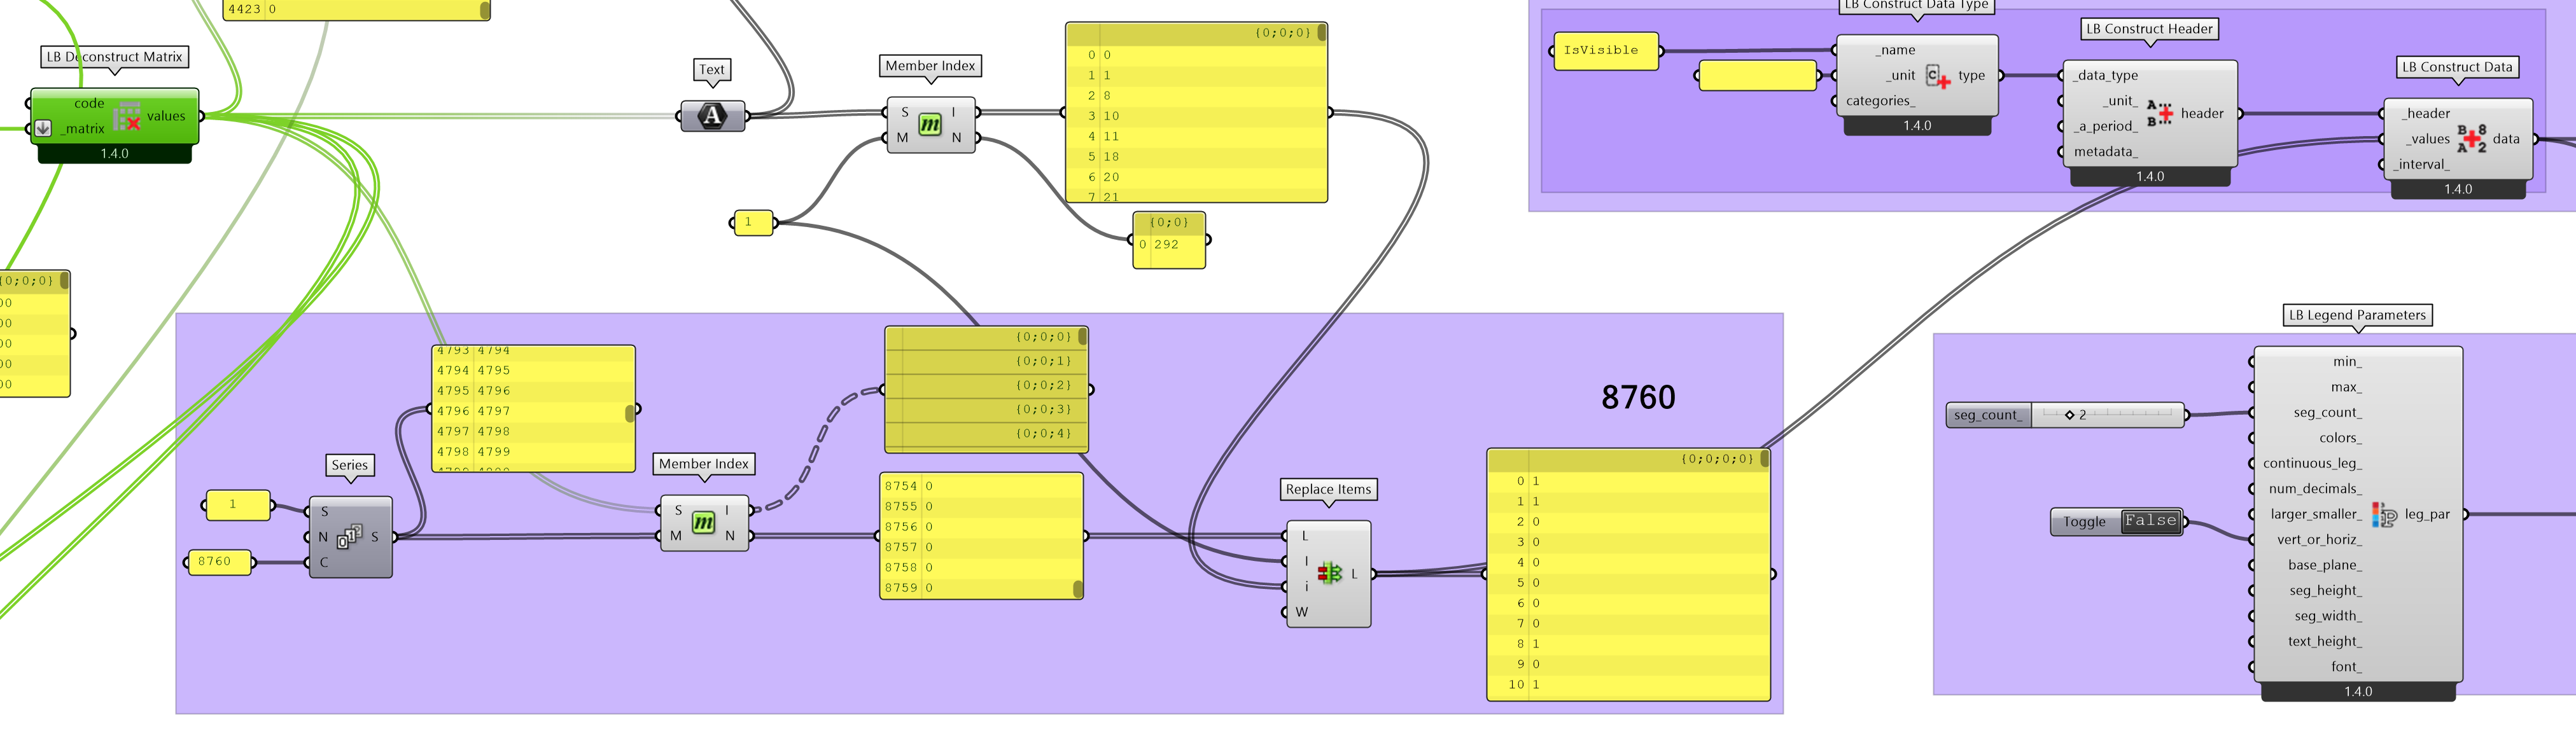
As I understand it, we aim to reach 8760 values, having 4424 of them, and knowing the remaining part would be 0, hence during the night.
What I don’t understand is, if the position of the added values plays a role?
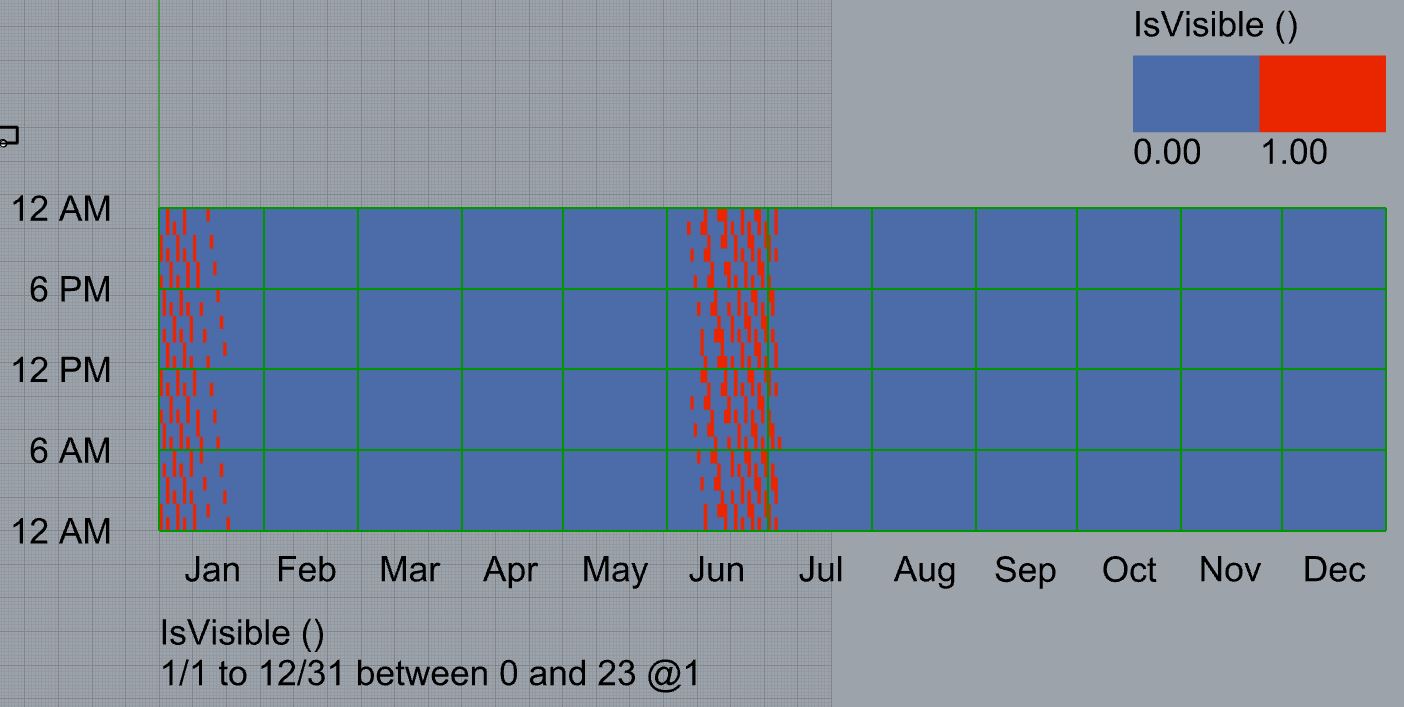
The reason of my questions is the result I get from the graphic. It clearly show the sun is visible at times during the night.
Here is my grasshopper file:
LBT_sunisvisible_220120_a.gh (69.0 KB)
Any input and explanation will be of great help and much appreciated.
Also, how would you recommend that I proceed with learning this software, any online materials or courses I could check?
Thank you all,
Hristo