Hi everyone!
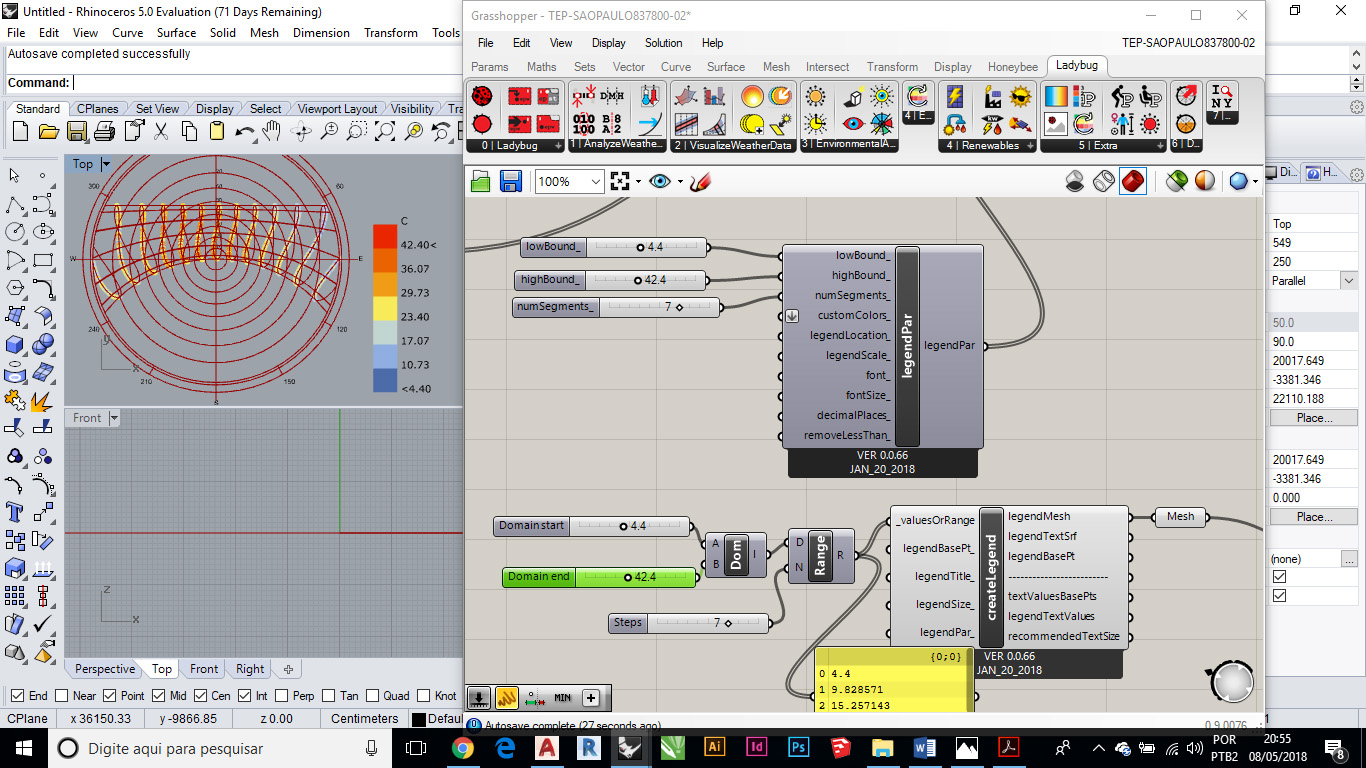
I would like to define a legend with unequal ranges for temperature values plotted on the sunPath (Ladybug). So instead of defining a number of segments between the low and high Bounds, how could I define these unequal ranges?
The ranges would be like this:
4.4 to 19.5
19.6 to 27.2
27.3 to 42.4
Ladybug doesn’t support unequal intervals. This has been addressed in Ladybug[+] but then Ladybug[+] currently doesn’t have a legend .
The workaround is to replace the input values with 3 numbers based on the range and you will get 3 colors. It still doesn’t fully address your issue and you still have to create a custom legend but fixes the colors for positions.
could you please explain a little bit more about the custom legend? how do I replace the input values with three numbers in order to have the colors fixed?
Hello,
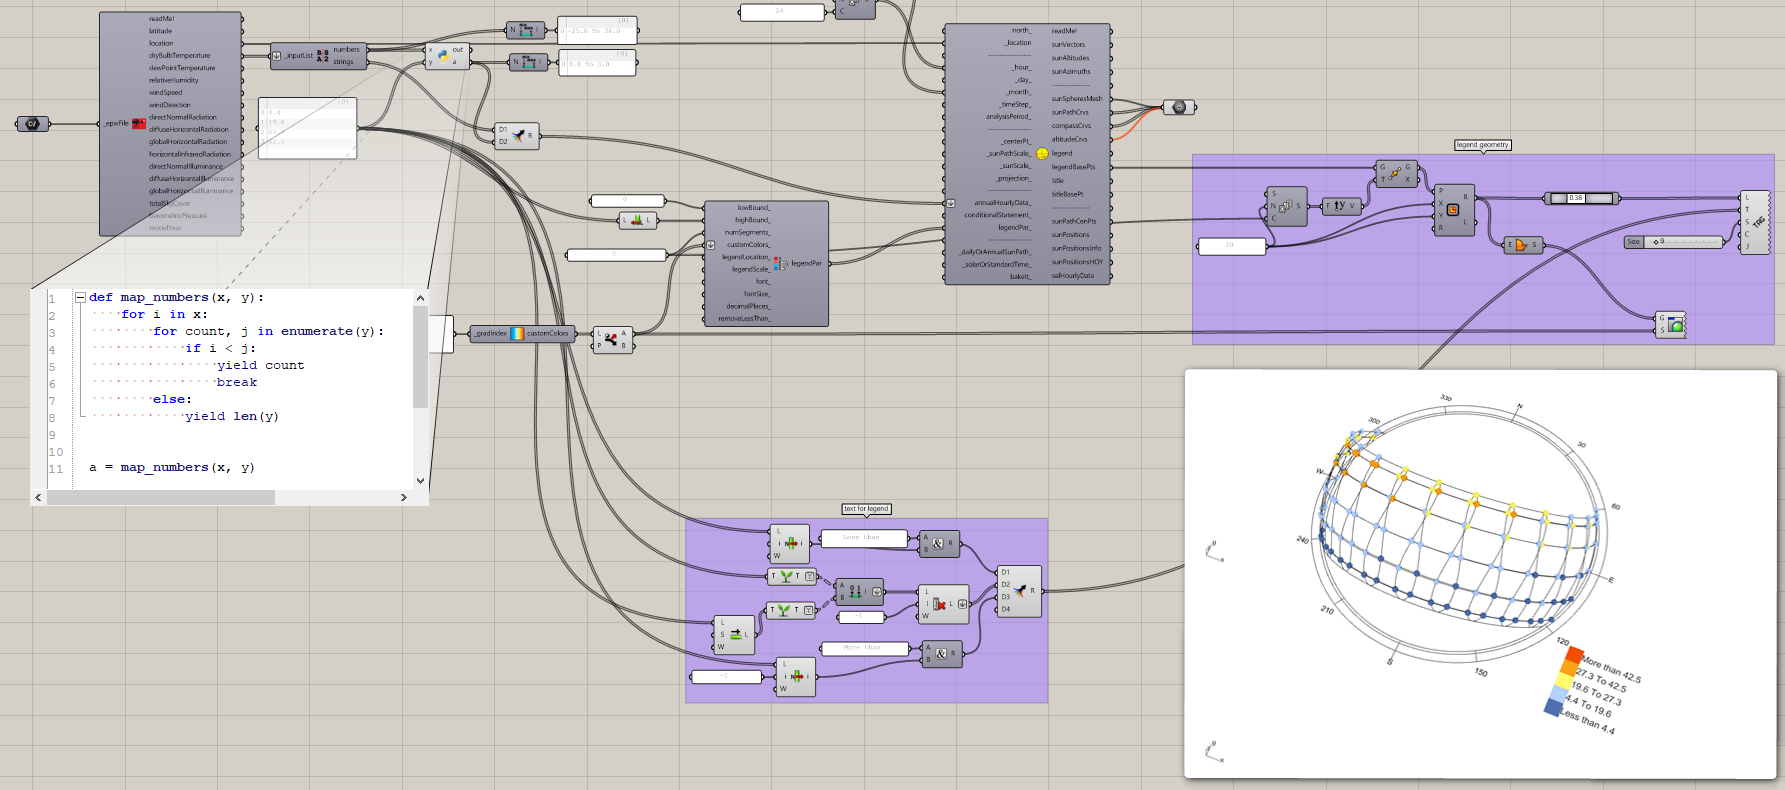
I was just about to make a new thread but I felt like these two are somewhat connected. I was wondering if something similar could be done with “radiation analysis”. I know i can set up colors I want for the legend, but still - the colors placed on an analyzed geometry seem to blend the input colors creating a gradient. Let’s say i use 5 colors for “legend paramaters” - I would get 5 colors on the legend but the geometry would use (let’s say) 20.
I managed to separate points on mesh into groups and assign a color, but still - I do not know how to color each face accordingly.
The picture shows a gradient mesh from “radiation analysis” and 5 groups of colored points that each face should match.
 .
. positions.