Thanks @josephyang for going into the subtleties of reanalysis data. Just to make sure I understand this completely, when you say the following:
On the other hand, to consider airport data as ‘real’ and reanalysis data as ‘simulated’ or ‘approximate’ is a bit of a mischaracterization I think. One way to think of it is to consider the room temperature as reported by your thermostat vs. another that takes in the thermostat reported temperature, plus a thermal imaging of the room, the location of the thermostat in the room in relation to the window, and the laws of thermodynamics etc. There is much more math involved in the latter processing but it doesn’t make it anymore unreal. NREL also recommends using gridded data over point-source data, probably because deriving radiation parameters from airport-reported sky coverage is really quite problematic (as I discussed here).
Is it also a mischaracterization to think of the bilinearly interpolated data between the gridded data as an ‘approximation’? I’m thinking that the bilinear interpolation process between grid points, in a literal sense, is just the approximation of intermediate values based on some arbitrary function, and can give different results if it’s linear or some wacky high order polynomial:
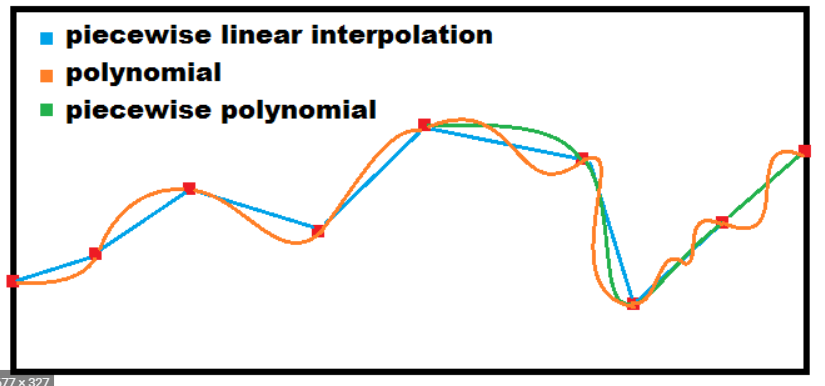
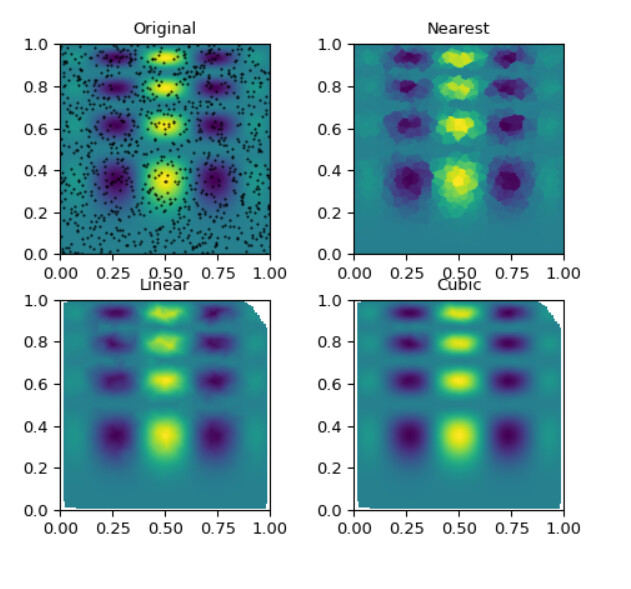
We can see the bilinear analog here, with more smoothing for higher order polynomials:
That’s what I’m thinking of as the approximated value, since it’s essentially a line of best fit - not actual data. And unlike the real data source (i.e airports) the uncertainty associated with this dataset is not just from the measurement, but also uncertainty related to which function is chosen and how well it represents weather at that given location.
On the other hand, I can see how my reasoning can be wrong if there is in fact actual, continuous data available (i.e your thermal image example) that is used to fill in these gaps, and thus it’s not a naive or crude interpolation as I think it is.