Hi everyone! Hope you all had a fantastic Christmas, and hope everyone’s well and safe.
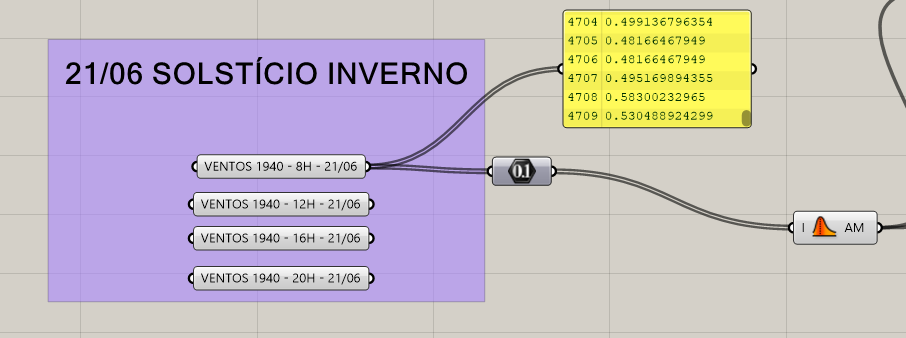
I got 2 doubts: the first, I’m trying to generate an average UTCI map, but firstly, I have 4 lists with 4709 wind velocity values from a butterfly simulation, and I’d like to generate a final list with 4709 average wind values, in which is averaged across the 4 wind values lists I have, and the values are calculated line by line. This workflow I tried, gathers all the lists into a single one, so I have 18840 values on the final list.
Dont know if I was clear enough
My second and final doubt is regarding Chris, Mostapha, Leslie and Theodore’s work: “Wind, Sun, Surface Temperature, and Heat Island: Critical Variables for High-Resolution Outdoor Thermal Comfort”, I’d like to know how is the workflow behind the creation of the UTCI error margin map:
The first question sounds like it’s about how to use Grasshopper data trees. You can try grafting all of your lists of values, putting them all together, and then use the native Grasshopper “Flip Matrix” to get a data tree with 4 branches, each of which can be averaged.
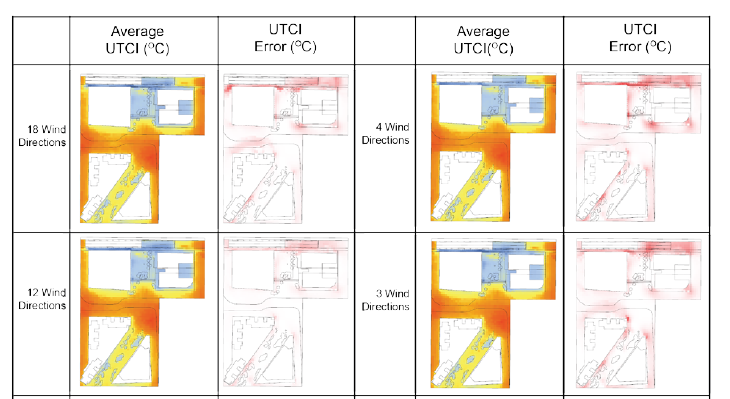
For your second question, the error maps were generated by comparing the UTCI values at each hour of the simulation to the “most accurate thermal map” that we could produce, which was built from the results of 36 CDF simulations (one for every 10 degrees of orientation)
Hi Chris! Hope you had a fantastic Christmas and new years eve. Sorry for the late response
Thank you for the answers, I still have some questions regarding the second topic.
The error maps were created using Grasshopper right? Is there any specific workflow behind it? You use a specific component to create the gradient error maps (ranging from white to a red-ish kind of color)?
I’m asking because I’d like to try to assemble an error map for my dissertation.
I’m doing an chronological approach in an urban canyon in my city, on 3 different years of analysis (1940, 1980 and 2020), and 2 different days of analysis for each year (summer and winter solstice) and 4 different hours of the day (8am, 12am, 4pm and 8pm). So I was able to create an average UTCI map for each day of analysis, using 4 CFD simulations with 4 different directions and speeds (which is reasonably accurate according to the paper right?)
So I’d like to create an error map by comparing the most accurate map (done with 4 different CFD simulations with different directions) with the other maps assembled with 3,2 and 1 wind directions. Is it a difficult workflow to assemble?
Thank you for the orientations Chris!
Regards
Daniel
The workflow is not that sophisticated. It’s literally just a native Grasshopper “Subtraction” component followed a native Grasshopper “Absolute” component to take the absolute value. Then, I think I used a native Grasshopper “Average” component to get the average difference in temperature over time.
You can input Legend Parameters into the LB Spatial Heatmap component and use the 16 - Shade Harm option in the LB Color Range component to get the white-to-red color scheme that I used.