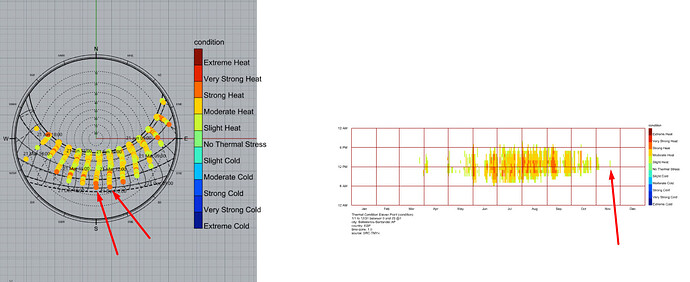
Hi to all,
I am trying to plot the UTCI categories on a sunpath, however when I plot the hourly UTCI categories the color range varies. In the sunpath during November some hours are sown as strong heat whereas in the hourly plot these hours remain as slight heat. It is quite confusing that both have the same inputs but report different plots contradicting each other. It is my understanding that the hourly plot is correct based on the location of the analysis. Therefore, does anyone know how to fix the sun path to plot the proper color range?
Mismatch Sunpath vs Hourly plots.gh (69.9 KB)
Thanks,
Julio
