Hi,
I can’t quite figure out if this is a bug or, I’m doing something wrong here. But would love get an extra pair of eyes on this problem
I built a wind rose script, and I started noticing that some colors, that were present on the legend graph, were not present on the wind rose display.
As a new user, I can’t upload files yet, so I uploaded 3 files here:
https://drive.google.com/drive/folders/1JjDMwYGelhZ4b27UeZz9M7G2Q79rmKNW?usp=sharing
- The image as it shows up in Rhino (unbaked)
- The Grasshopper script in question
- The EPW file converted to an excel file (by use of Climate Consultant data export function) for easier counting
in the GH/LB Script, the EPW is directly imported from the following link:
https://energyplus-weather.s3.amazonaws.com/europe_wmo_region_6/ISR/ISR_Beer.Sheva.401900_MSI/ISR_Beer.Sheva.401900_MSI.zip
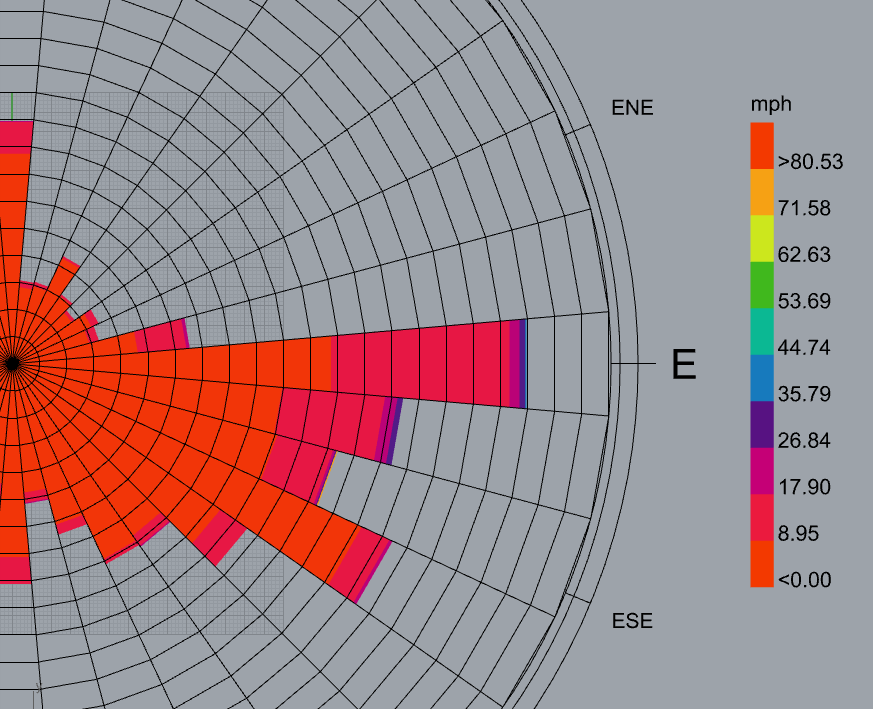
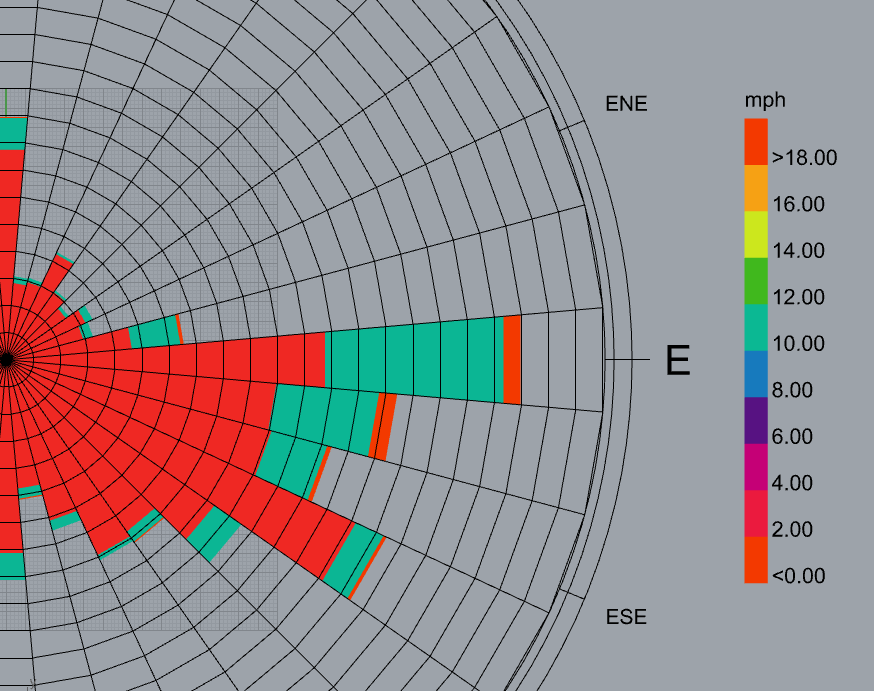
As you can see in the image(1.), the wind rose really only has 3 colors (dark green, yellow, and red)
The legend has 10 bins and therefore 10 colors (ranging from dark green to red)
Just focusing on the East(90°) direction, I count:
12-ish bins of green,
6-ish bins of yellow and
1-ish bins of red.
for a total of 19 bins
in the EPW file, I have 455 hours of due East(90°) wind, so with the 24h bin size I should have 18.9 bins. So that is accurate.
When I look at the breakdown of those 455 hours I’m seeing a nice spread between all the bin values. So I don’t quite see why I’m only getting 3 colors on my wind rose.
| Bin | Hours |
|---|---|
| 0-2 | 4 |
| 2-4 | 59 |
| 4-6 | 86 |
| 6-8 | 54 |
| 8-10 | 79 |
| 10-12 | 66 |
| 12-14 | 50 |
| 14-16 | 5 |
| 16-18 | 30 |
| 18+ | 22 |
I did notice the EPW file had some outlier data. with one 80 mph value recorded on March 30 (3rd hour) (Row 2119 in the excel, for the diligent detective). So I wonder if that has anything to do with it.
Could it be that there is part of the routine that creates bin sizes based on the min/max of the actual data (speeds 0-80) Then counts according to those bins, rather than the legend bins. And then finally assigns a color based on the legend?
Thanks for your help
Peter
Edit: The LB/GH script has a site dropdown switch at the very top, where you can switch between New York City and Be’er Sheva. If you change to the NYC epw file, more bins do show up. The NYC file has a highest average windspeed of 40 mph. so not as big as a outlier as the 80mph in Be’er Sheva.