Hey guys,
I’m doing a comparative analysis between the variables of 3 climate files and I have two questions about this:
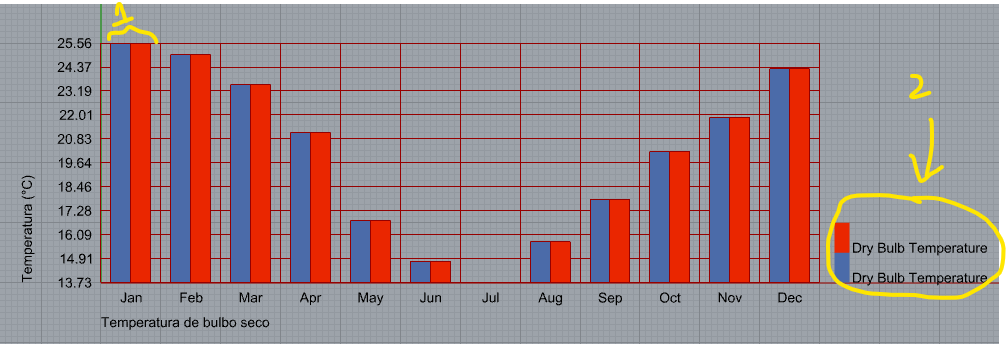
I’m trying to compare dry bulb temperatures between these files and I would like the data representation to be in a single column per month. But when I put “true” in the “stack” field the view remains the same. How do I change this?
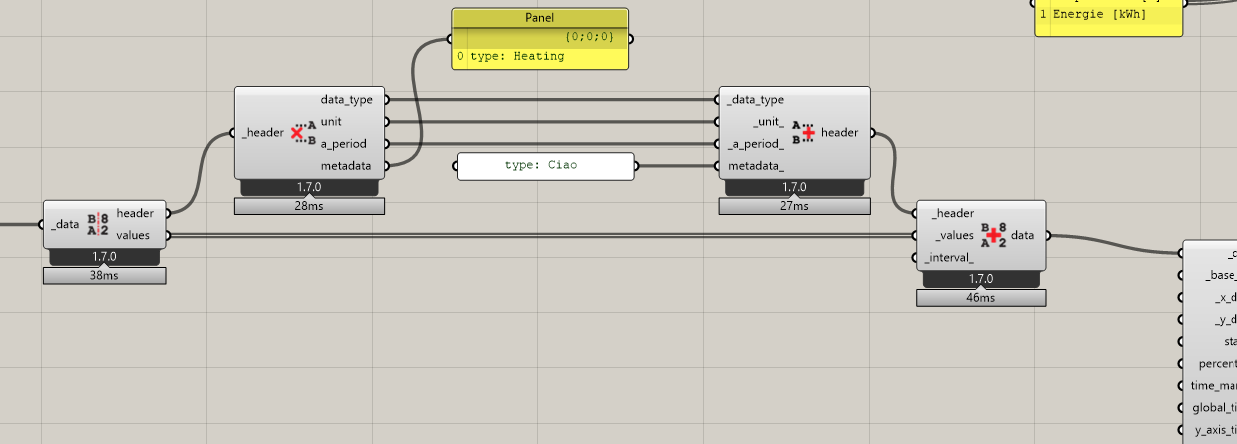
I need to modify the caption, because as I am analyzing the dry bulb temperature from different climate files, I would like the names of the two cities to appear, as shown in the image below. How do I modify this text?
I stumbled upon your conversation as I have the same problem. I see that with help you managed to solve one of the problems (if I understood correctly), but I’m courious if you found the solution to the second one? With the script from @Erikbeeren I could change the legend on the left, but I only managed to change “Dry Bulb Temperature” to a different name after baking and changing the names in rhino. I’m wondering if it’s possible to do it in grasshopper.