Hi everyone,
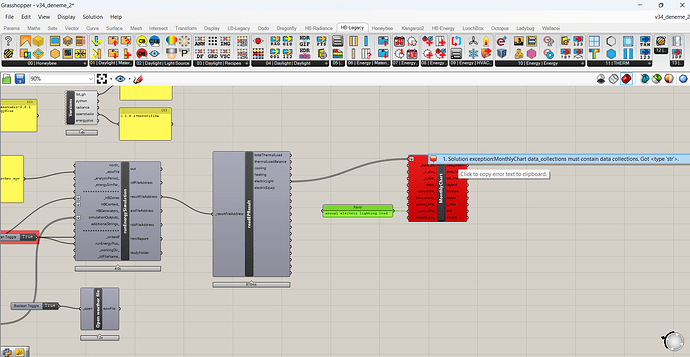
Whaen I try to visualize my energyplus result I face an error called “1. Solution exception:MonthlyChart data_collections must contain data collections. Got <type ‘str’>.” I checked the forums but couldn’t find the solution.
here is the image:
Any help would help,
Thanks in advance…
Pelin
