Hey all,
I am running some steady-state MRT simulations to determine the PMV/PPD for various window configurations. On the PPD estimates, I noticed that the results are non-symmetrical to the floor plan/analysis grid and not I am not sure why that would be in this simulation which does not account for solar or other transient conditions and the window design is consistent across the whole facade. Walls are adiabatic and the only exterior surfaces are the walls and windows that are previewed at the top of the image.
Examining the MRT outputs (view factor, surface temp, and MRT), it appears that points on opposite sides of the room with the same view factors, but different PPD values, have different MRTs. See the two images below for the points taken along the left and right wall.
Does anyone know why this would be?
The text overlay on the analysis grid in the images shows the MRT, not PPD. The grid is colored for PPD.
Rhino and GH files are attached.
Results from analysis point on the LEFT of the grid:
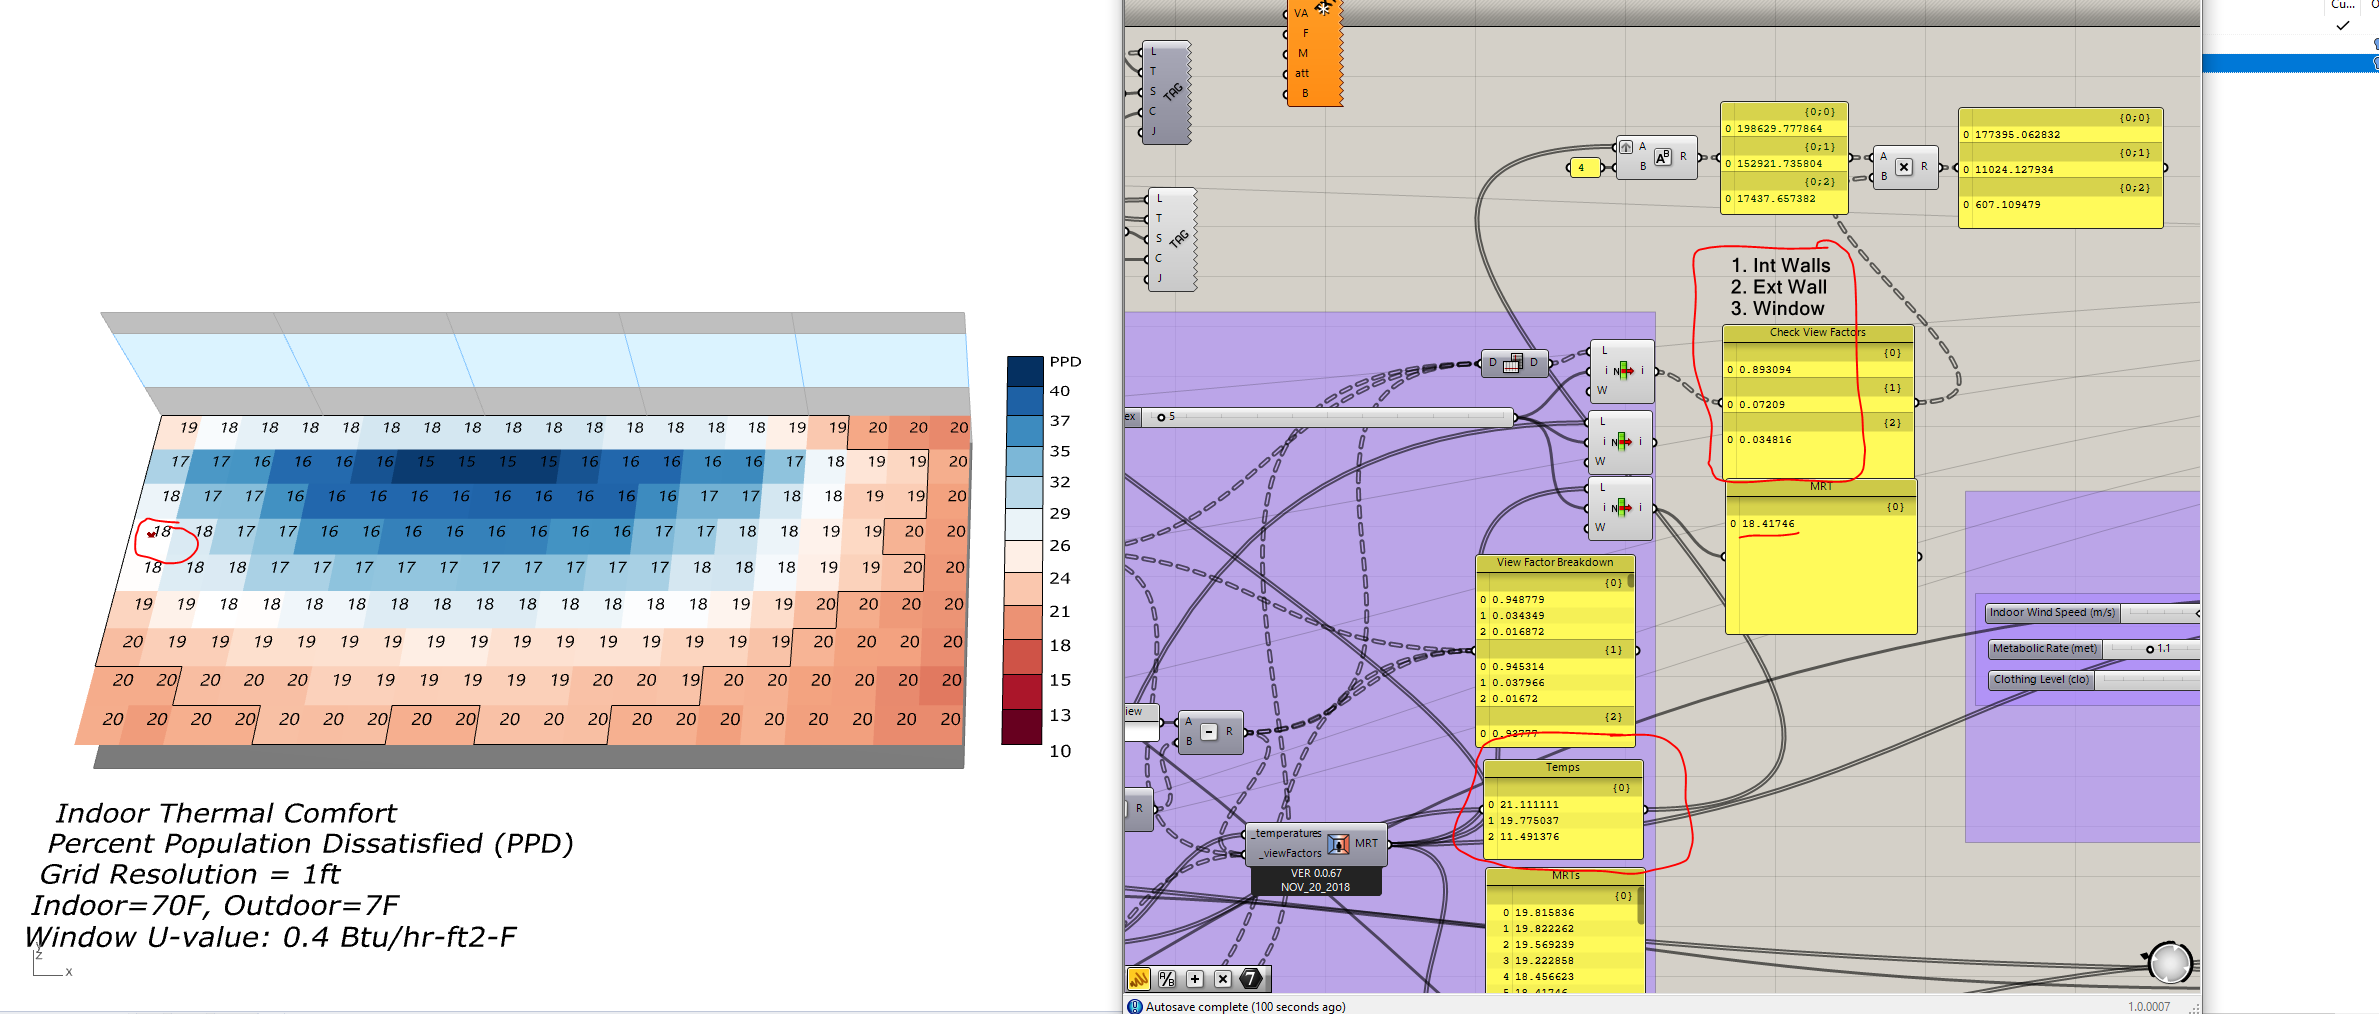
View Factors read (approx): 89%, 7%, 3% with temps 21.1C, 19.7C, 11.5C and MRT of 18.4C
Results from analysis point on the RIGHT of the grid:
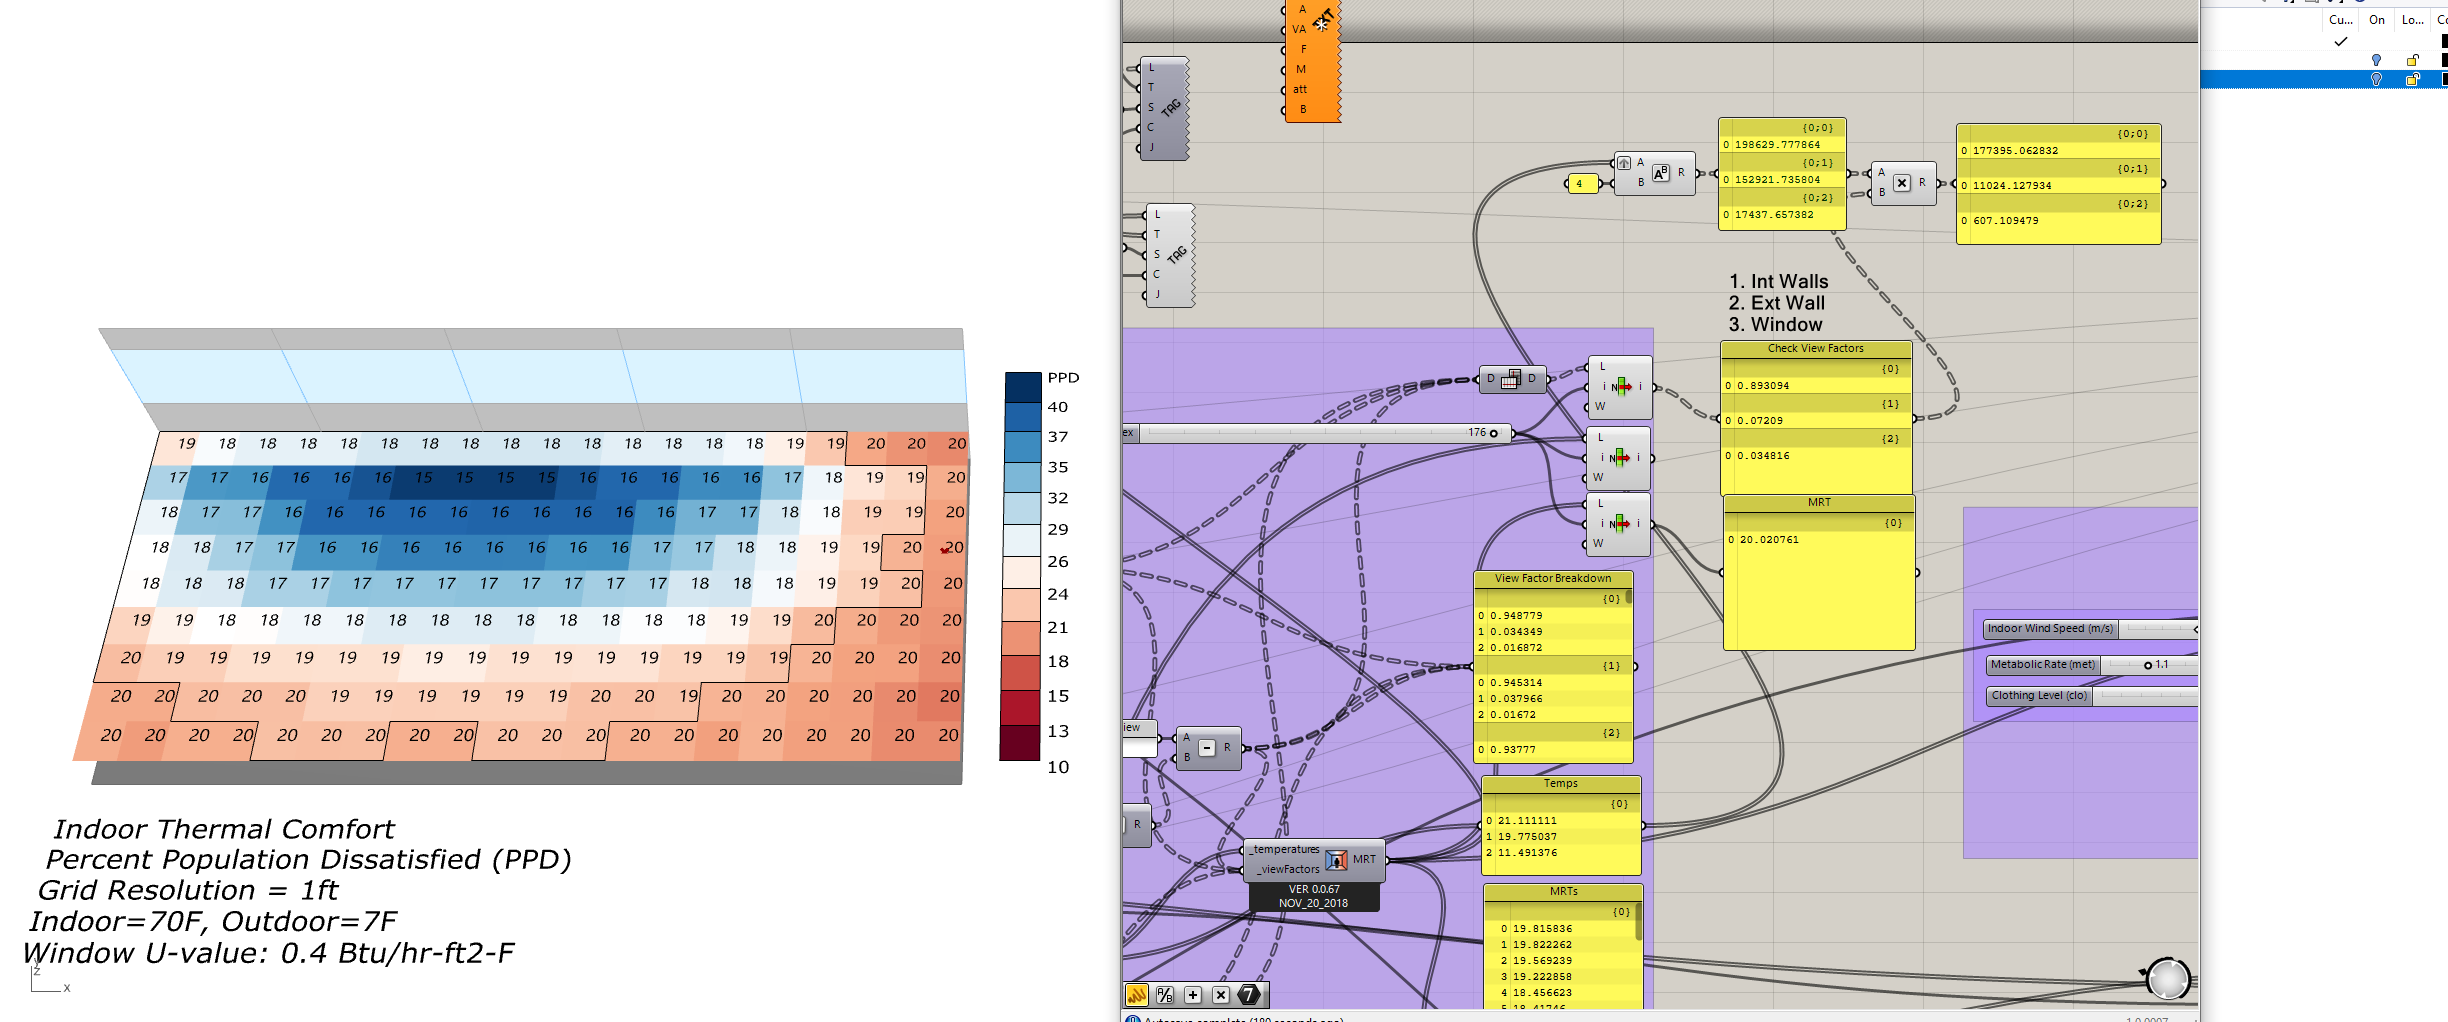
View Factors read (approx): 89%, 7%, 3% with temps 21.1C, 19.7C, 11.5C and MRT of 20.0C
Thermal Discomfort_LBDiscourses.3dm (100.8 KB)
Thermal Discomfort_SteadyState_191104_LBDiscourses.gh (555.2 KB)