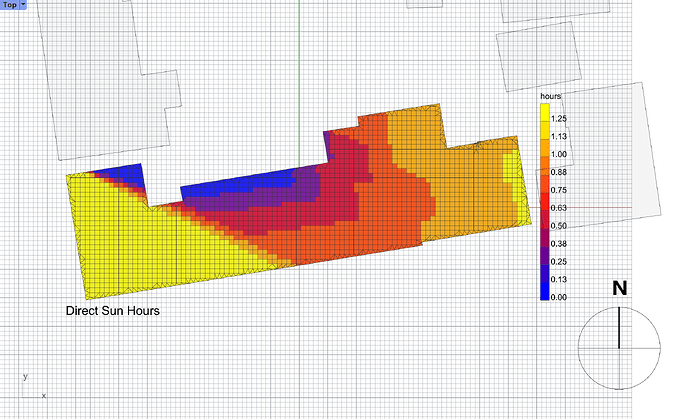
Hello, I’m currently using a timestep of 4 for Ladybug’s direct sunlit hours analysis. Is there a way to obtain data for each individual timestep, indicating whether each area is lit or not? Right now, I only get an aggregated value for the entire hour between 17:00 and 18:00. However, I would like to obtain 8 separate values for each area, showing whether it’s lit or not at each 15-minute interval (e.g., 17:00, 17:15, 17:30, 17:45…18:00)
I guess the solution to your problem is already discussed here. A question about timestep - #6 by Zed
Hi Naga,
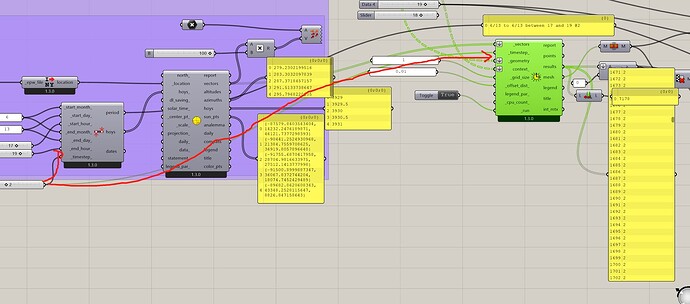
Thank you for your reply, but I have double checked my script, and the timestep is connected to both LB direct sunlight hours and the LB Analysis period components… I have attached my script below
Hi Naga,
Thank you for your reply, but I have double checked my script, and the timestep is connected to both LB direct sunlight hours and the LB Analysis period components… I have attached my script below
Hi @vapeurz
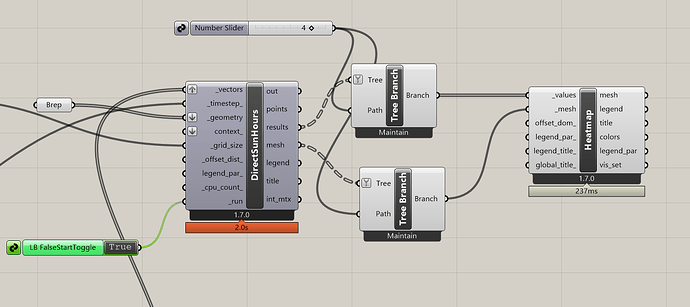
Sorry for delayed response. You can simply graft the vectors input in sun hours column to get sub-hourly/hourly (depending on timestep chosen) output. The only issue is Sun hours components cannot render the heatmap. So. I recommend you to select the hour and use spatial heatmap for visualization as shown below. I hope this is what you wanted.


