Hello everyone,
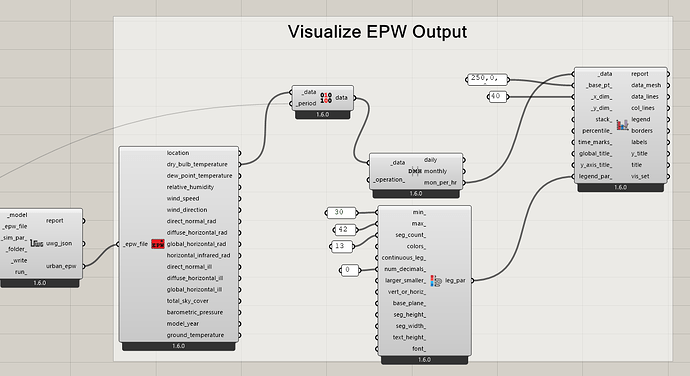
I am trying to obtain some data especially dry bulb temperature from a model I created in Rhino with the UWG of dragonfly. I saw this tutorial https://www.youtube.com/watch?v=gnsW4eJXq8Y but he does an average, while I am interesting to obtain hourly data, for a whole month or even the whole year. Any idea how should I proceed? And moreover how can I obtain this data in an excel sheet?
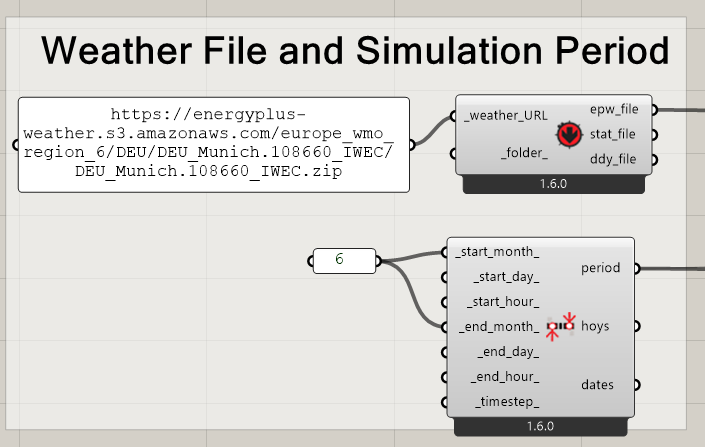
I wanted to start with the month of June
how should I change this script to obtain hourly data for the month of June (not average) in an excel file?
Moreover, wanted to ask the epw file we get from this map
https://www.ladybug.tools/epwmap/ does it have data from which year, one year before example 2022?
I would really aprecciate your help
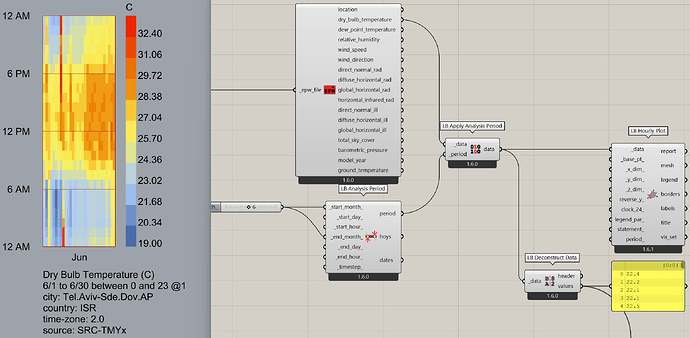
You are close. The workflow to get hourly values for a month should look like so:
For writing to excel there are many options to do so (look at tttolbox for instance).
-A.
1 Like
Thank you very much!
Since I am new to Grasshopper and Rhino I encounter some difficulties and I would appreciate your help.
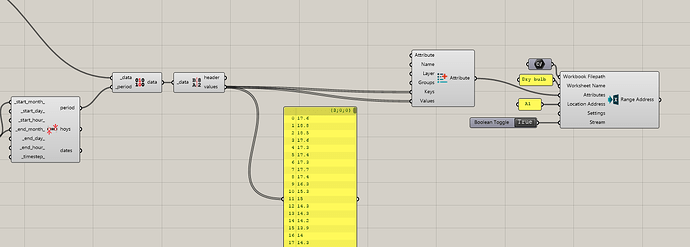
As you can see I already tried to manage in a way to write those data in excel the issues is the key component of Construct Attributes, I made them equal to the values , but it just repeats the data in two rows, which I think is expected, but I encounter another issue I have in total 744 datas (31 days x 24 hours) as I also see from the panel connected to the values, but in the excel it writes only 194 in the row as shown.
My question is how can I give values (hourly) to the keys and how can I obtain the values in the column form? I tried to search for an answer but I could find just the old version of write to excel not the new one.
Thank you in advance!
Taking one of the TTToolbox example as abase to write to excel as you want, this is what i suggest as an option:
You need to define a path for the excel file and also have the excel there (it can be an empty file).
You were almost there. Need to graft the values input.
Hope it helps.
-A.
2 Likes


