Hello how can just analysis 1 month with Schedule?
@mehdi212 Hello, you are using a component called HB Annual Daylight, I’m thinking that may be what is giving you such problems, what specific outputs do you need from the simulation?
Here are the returns for the ANN component:
Returns:
        report: Reports, errors, warnings, etc.
        results: Raw result files (.ill) that contain illuminance matrices for each sensor
            at each hour of the simulation. These can be postprocessed using
            various components under the 4::Results sub-tab.
        DA: Daylight autonomy results in percent. DA is the percentage of occupied hours
            that each sensor recieves equal or more than the illuminance threshold.
            Each value is for a different sensor of the grid. These can be plugged
            into the "LB Spatial Heatmap" component along with meshes of the sensor
            grids to visualize results. These can also be connected to the "HB
            Spatial Daylight Autonomy" component to compute spatial daylight
            autonomy for each grid. Note that the resulting sDA is only compliant
            with LEED if dynamic blinds have been simulated using the methods
            in IES-LM-83-12.
        cDA: Continuous daylight autonomy results in percent. cDA is similar to DA except
            that values below the illuminance threshold can still count partially
            towards the final percentage. Each value is for a different
            sensor of the grid. These can be plugged into the "LB Spatial Heatmap"
            component along with meshes of the sensor grids to visualize results.
        UDI: Useful daylight illuminance results in percent. UDI is the percentage of
            occupied hours that illuminace falls between minimum and maximum
            thresholds. Each value is for a different sensor of the grid. These
            can be plugged into the "LB Spatial Heatmap" component along with
            meshes of the sensor grids to visualize results.
        UDI_low: Results for the percent of time that is below the lower threshold
            of useful daylight illuminance in percent. Each value is for a different
            sensor of the grid. These can be plugged into the "LB Spatial Heatmap"
            component along with meshes of the sensor grids to visualize results.
        UDI_up: Results for the percent of time that is above the upper threshold
            of useful daylight illuminance in percent. Each value is for a different
            sensor of the grid. These can be plugged into the "LB Spatial Heatmap"
            component along with meshes of the sensor grids to visualize results.
best,
-trevor
hello
yes i use Annual Daylight .and just want 1 month analysis with schedule.
i need udi for 1 month with schedule.
Hello @mehdi212 this is how you can select just a month for the ANN sim:
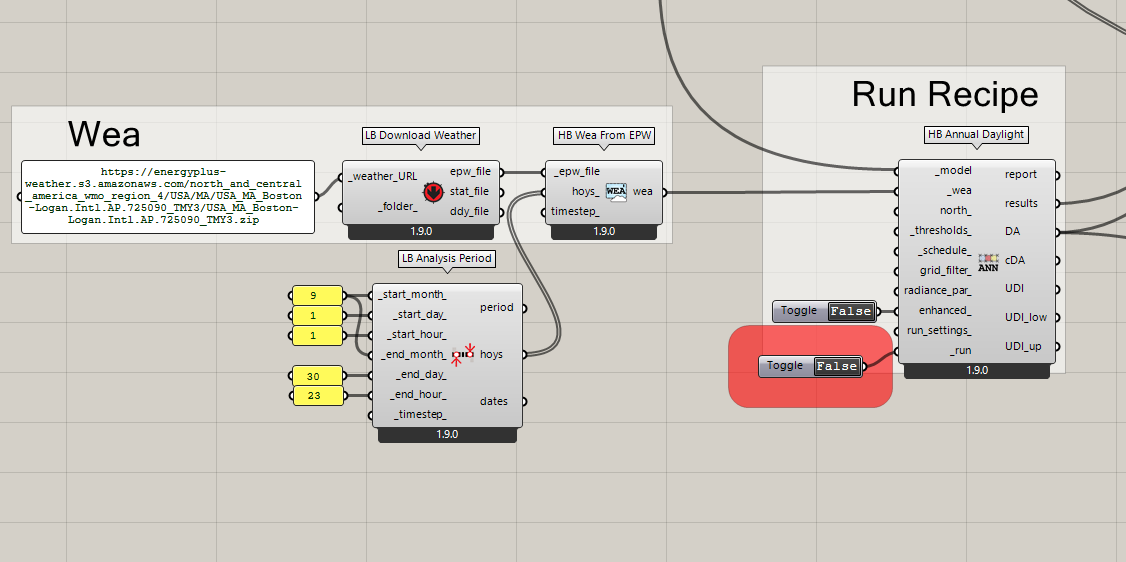
HOYs from the analysis period component, into the WEA component.
Add your schedule to the ANN component and I think you should be good to go.
Best
-trevor
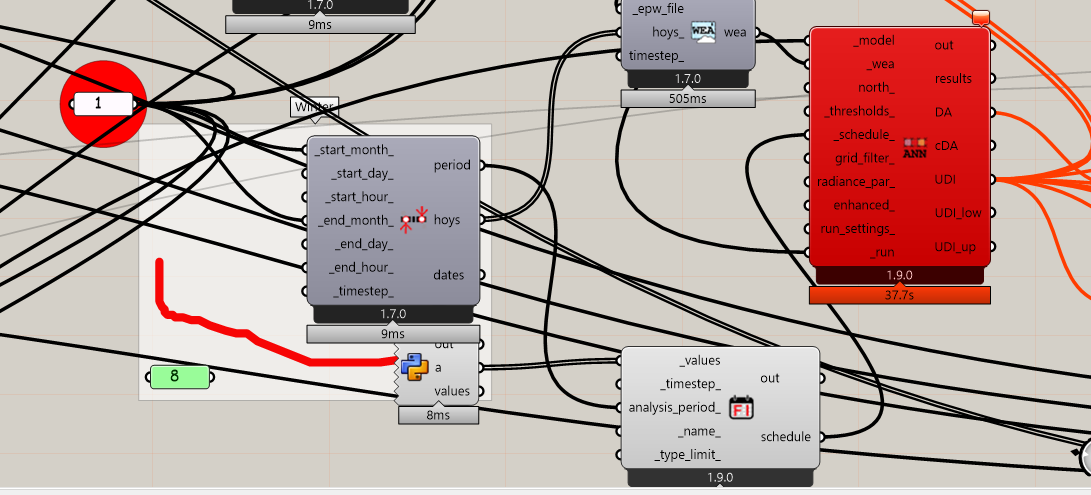
I did exactly that, but when I add the Schedule to the ANN component, it gives me an error.
just test it with Schedule (1 month Schedule )
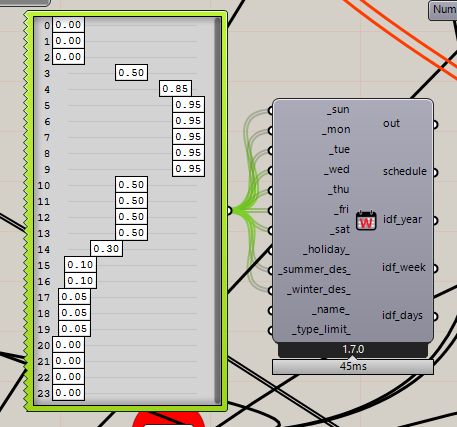
Hello again @mehdi212 can you post a picture of your schedule? I tested it with a schedule and was able to run the simulation
1 Like
Hi @mehdi212 I tested the test model again with both the WEA analysis period and your schedule and the simulation ran with no issue:
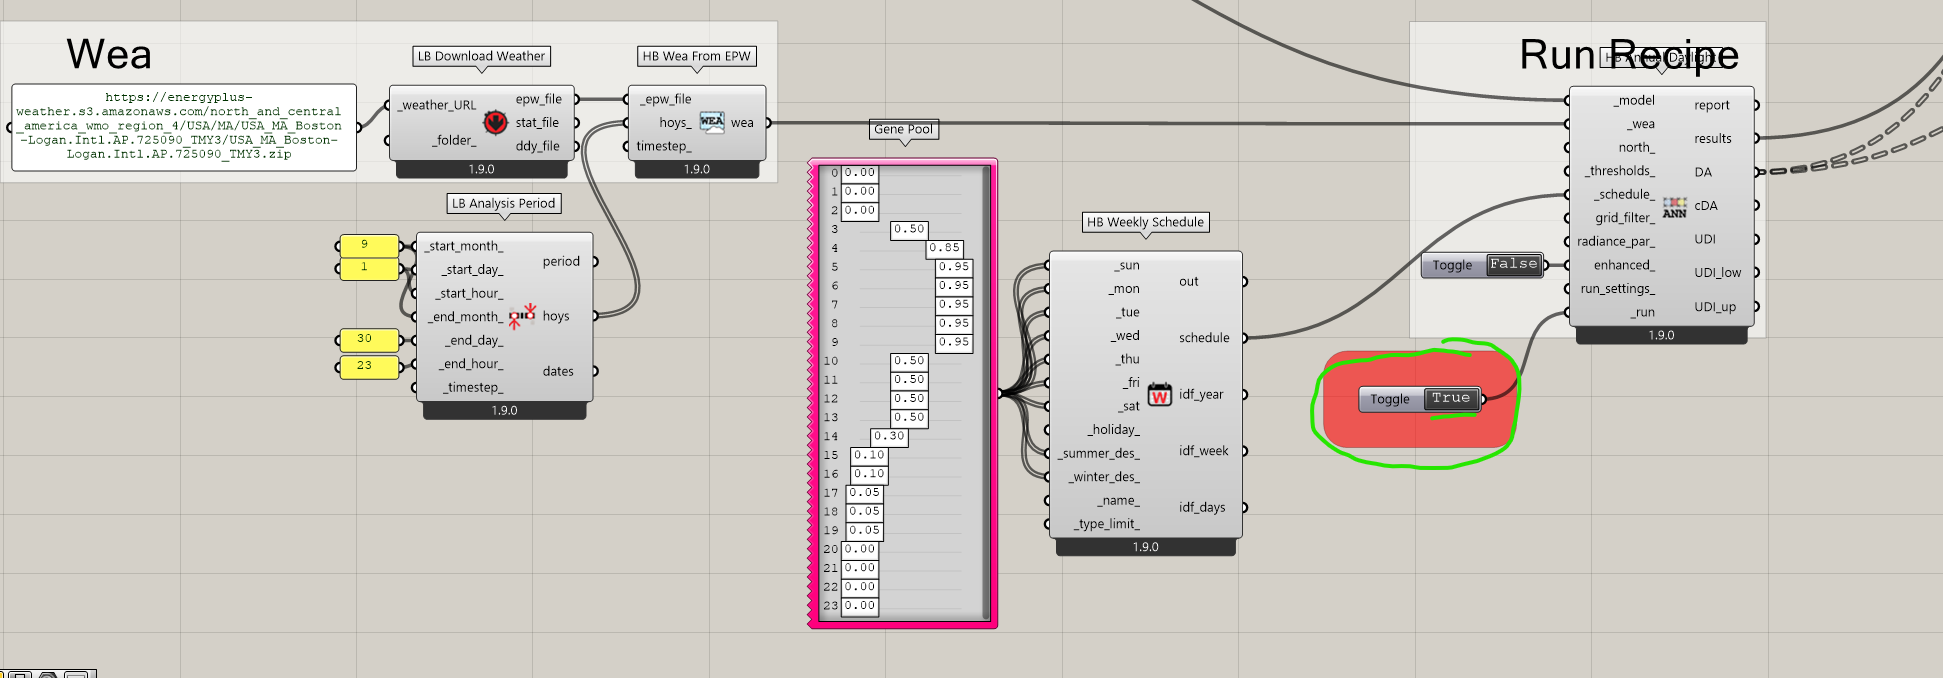
daylight_with_sch.gh (94.1 KB)
you can message me your model/script in private if you don’t want to upload it to the public forum if you would want me to take a look at it.
best
-trevor
1 Like
Hi Trevor — thanks, that’s helpful and I can reproduce the run too, but there’s a problem: the Schedule is being applied to the entire year, not just the Analysis Period. I need the Schedule to be active only for a single month (i.e. the HOYs corresponding to that Analysis Period), not for all 8760 hours.
Do you know a reliable way to make an ANN schedule apply only to the HOYs of the Analysis Period (or otherwise restrict it to a specific month)? I can share my file/script privately if that helps.
Best,
Mehdi