Hello,
I’m trying to assess the PMV comfort of a space with LBT 1.1.0. I haven’t found a way to create "dynamic clo values for the Clothing Insulation level apart from using the Ladybug_Clothing Function (0.0.69).
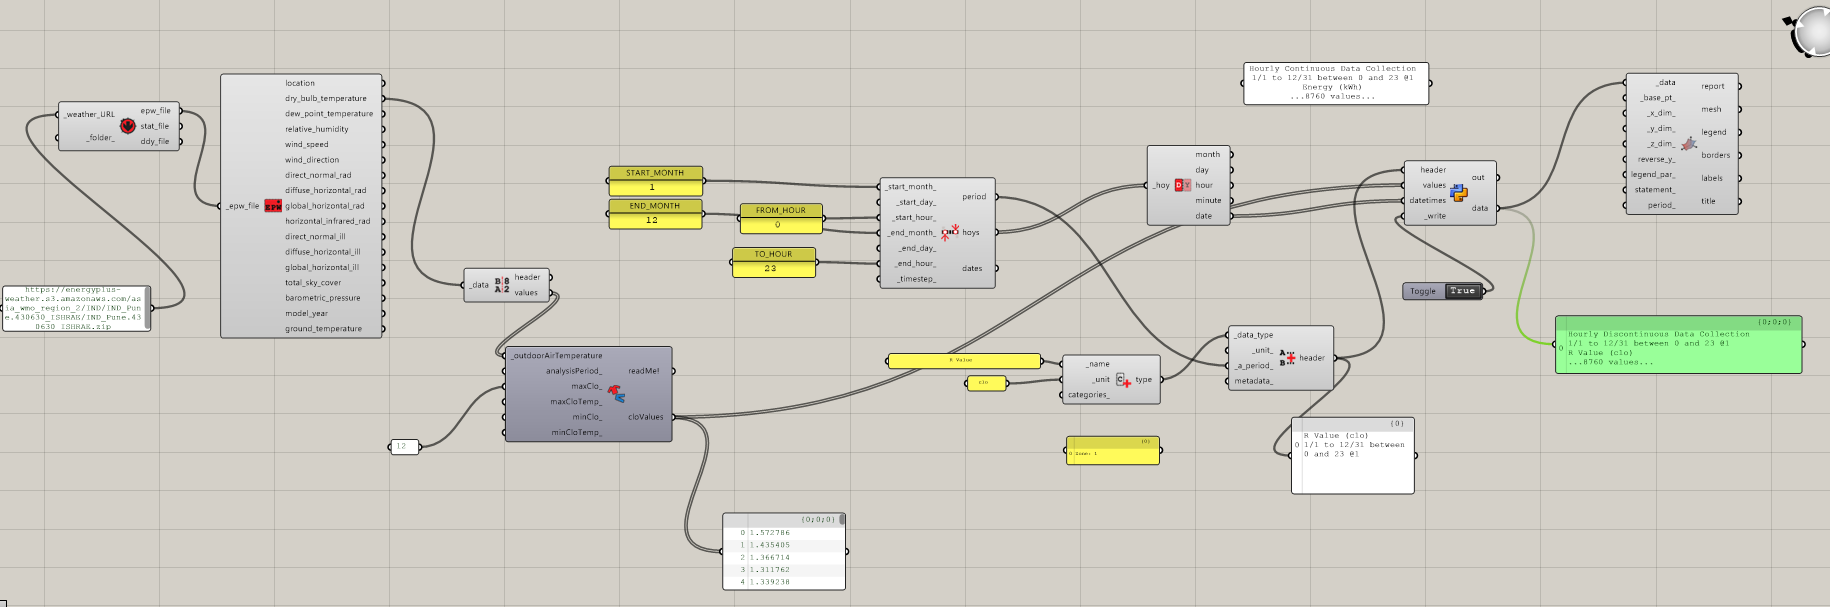
I got a list of 8760 values which I used to create a data collection, and plugged that into the LB PMV Comfort (1.1.0) component, which accepted it.
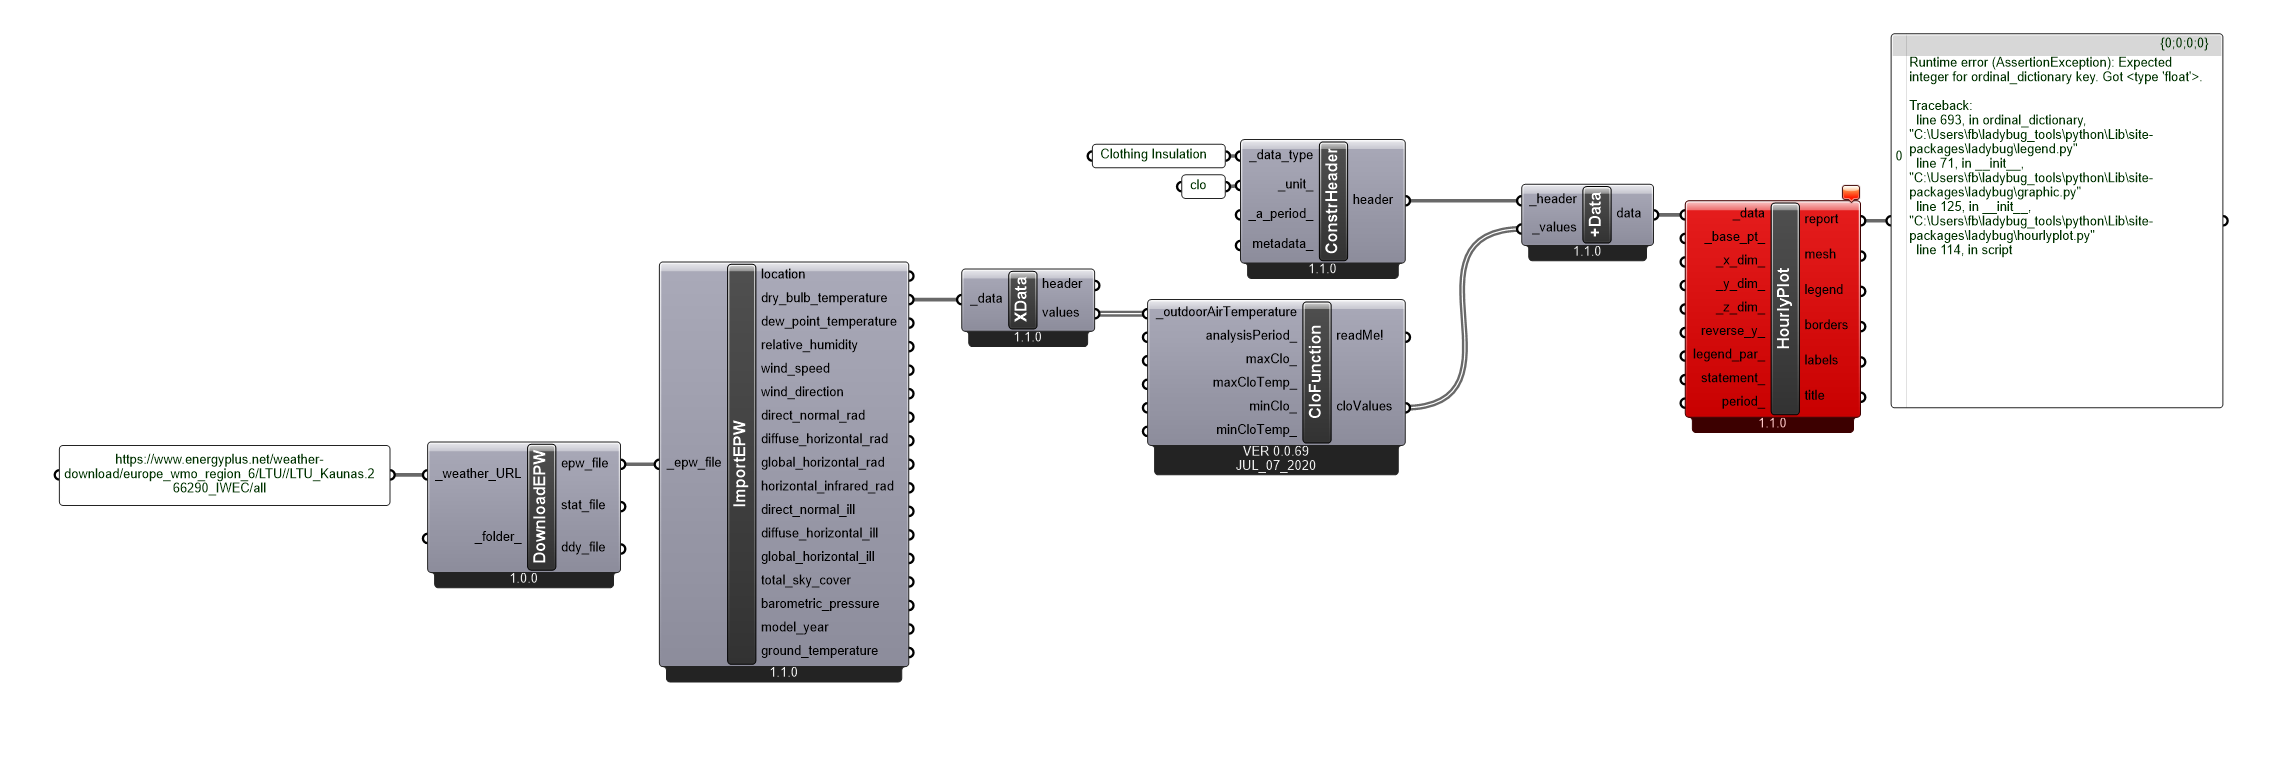
I tried to visualize the clo levels through the entire year, and plugged the constructed data collection into an Hourly Plot (1.1.0), which returned the following error:
Runtime error (AssertionException): Expected integer for ordinal_dictionary key. Got <type ‘float’>.
Traceback:
line 693, in ordinal_dictionary, “C:\Users\fb\ladybug_tools\python\Lib\site-packages\ladybug\legend.py”
line 71, in init, “C:\Users\fb\ladybug_tools\python\Lib\site-packages\ladybug\graphic.py”
line 125, in init, “C:\Users\fb\ladybug_tools\python\Lib\site-packages\ladybug\hourlyplot.py”
line 114, in script
Does anyone know how to solve this? I don’t even know what the error message means.![]()
It’s not urgent, I can use the old Ladybug_3D Chart (0.0.69) to visulize the inital float output, but I would be happy to understand what’s happening.![]() Am I doing something wrong?
Am I doing something wrong?
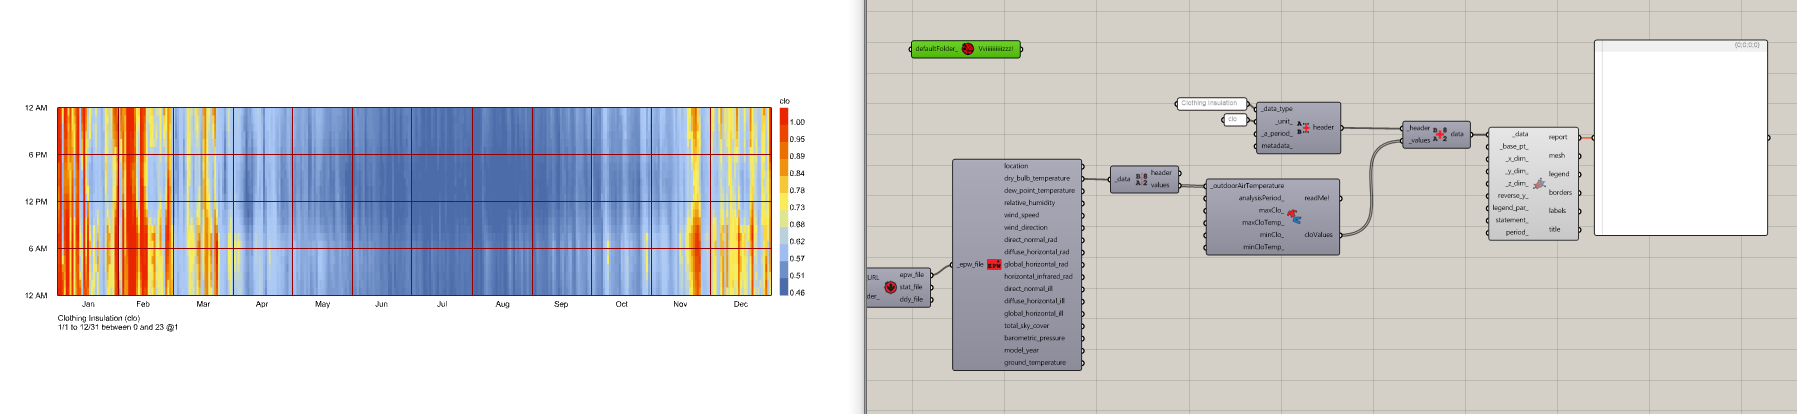
This is what I’m after:
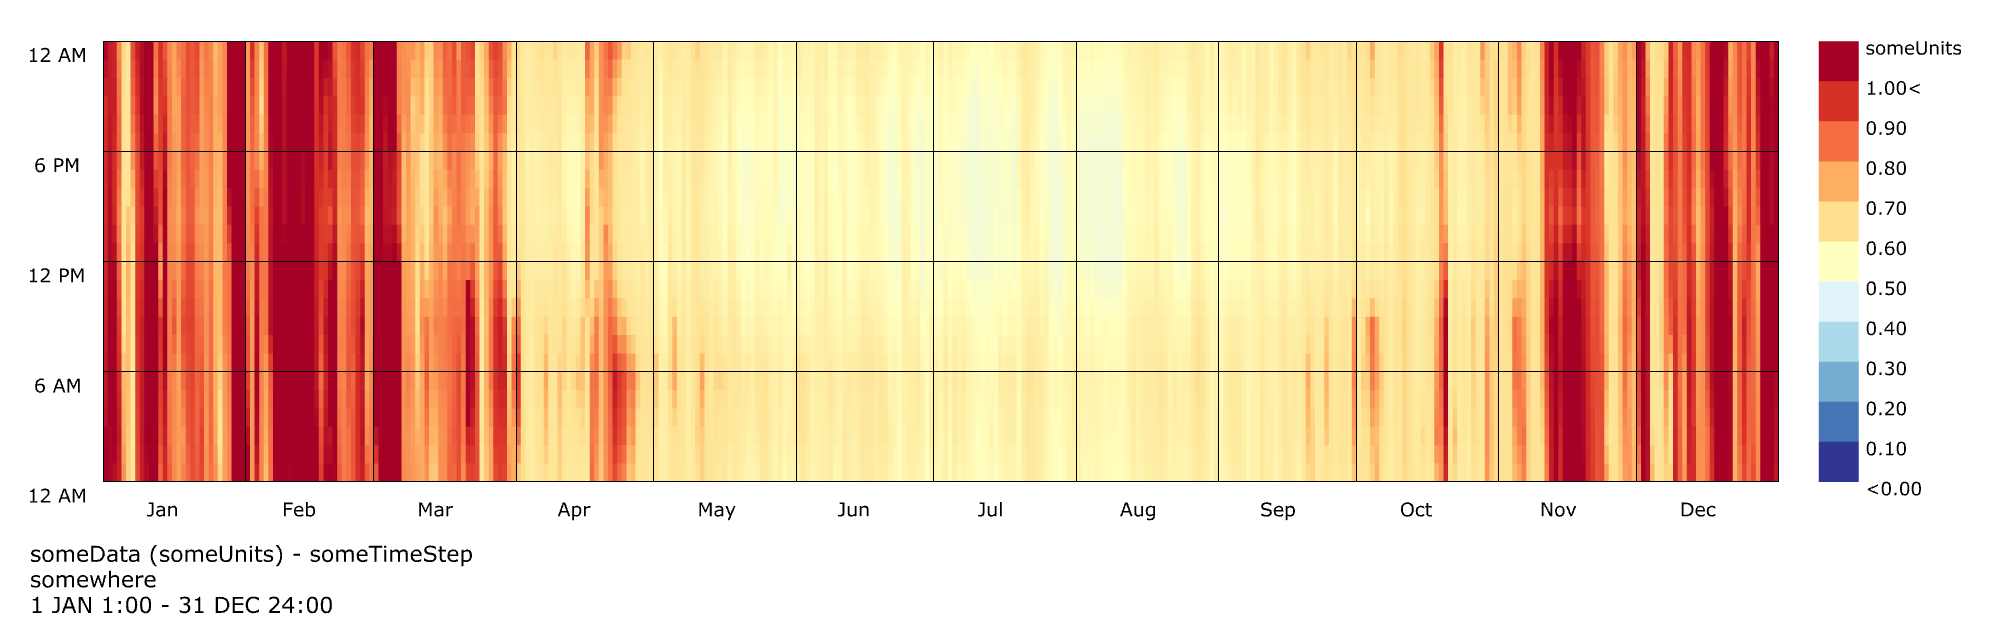
(Bonus question: where can I change the legend title and the chart title for Ladybug_3D Chart (0.0.69)? “SomeData: Clothing Insulation”, “SomeUnits: clo”, “SomeTimeStep: hourly”. I couldn’t find this…)
annual clo_hourly plot error.gh (30.3 KB)