Outdoor Comfort surface grid

Hi @chris,

I was looking at the outdoor comfort example and used it to get surface temperatures using the energy simulation (HB model to OSM). As the top surface is devided into smaller parts I expected that effects of shadowing would show up in the surface temperatures on a certain time spot. When I look at the temperature values of each square, they are all exactly the same.

In the past I used the HB ground and was able to see the effect of shading clearly, which I think is also more conform to reality. My question is why, if there is no local effect visible, is the top surface divided into smaller squares? And why does the shadowing of the tree not effect the surface temperature below the tree.

Hi, @Erikbeeren - can it be because of the range of the legend. What are the exact values? Also, what did you set the shadow calculation settings for this in EnergyPlus? And did you check to ensure the tree was exported to OSM/IDF?

Hy @mostapha

I did not change much to the original model. I only added the HBmodel to OSM to run the simulation with default settings. The temperature values of the top surface are alle exactly the same. 49.942678 degrees.
outdoor_comfort_under_a_tree.gh (139.5 KB)

This is a red flag to me and tells me that the shading calculation is the issue. I would focus to debug that.

  1. Are the shades exported correctly?
  2. Is the settings for shadow calculation set to be accurate enough for this case?

Hi @mostapha,

If I import the generated osm file using the “HB load gbXML OSM IDF” component I get the following picture:

So I have no doubt about the shadings being exported correctly. The shadow calculation settings I used are just the default settings: “FullExteriorWithReflections” Method: “PolygonClipping”. With “PixelCounting” I get exactly the same result.

Hi @Erikbeeren, @mostapha,

Using Erik’s script he linked above I also get the same issue with the surface temperatures being exactly the same.

Trying it in one of my sample scripts I don’t get the issue. I have the same simulation set up as Erik.

But with the correct result

Erik - here’s my script for you to test if that’s of use.
UTCI_example_comfort_under_a_tree_with_visualisation_tools_LBTForum.gh (130.7 KB)

2 Likes

Thank you @charlie.brooker for checking this out. I compared the two scripts and finaly could find out what was causing the problem. The “Grassy Lawn” soil construction is the bad guy. Somehow if applying this construction type, shading is not taken into account.

3 Likes

Hi @mostapha,

Why is this “Grassy Lawn” construction not effected by shading.

That’s a good question. I would open a new topic and mention @chris! I don’t know the answer.

Good detective work, @Erikbeeren and @charlie.brooker .

The more that I find out about this roof vegetation model, the more and more skeptical I become of it. Clearly, EnergyPlus is still modeling the detailed solar distribution for this case since the Surface Outside Face Incident Solar Radiation Rate per Area output still shows radiation falling onto the surfaces:

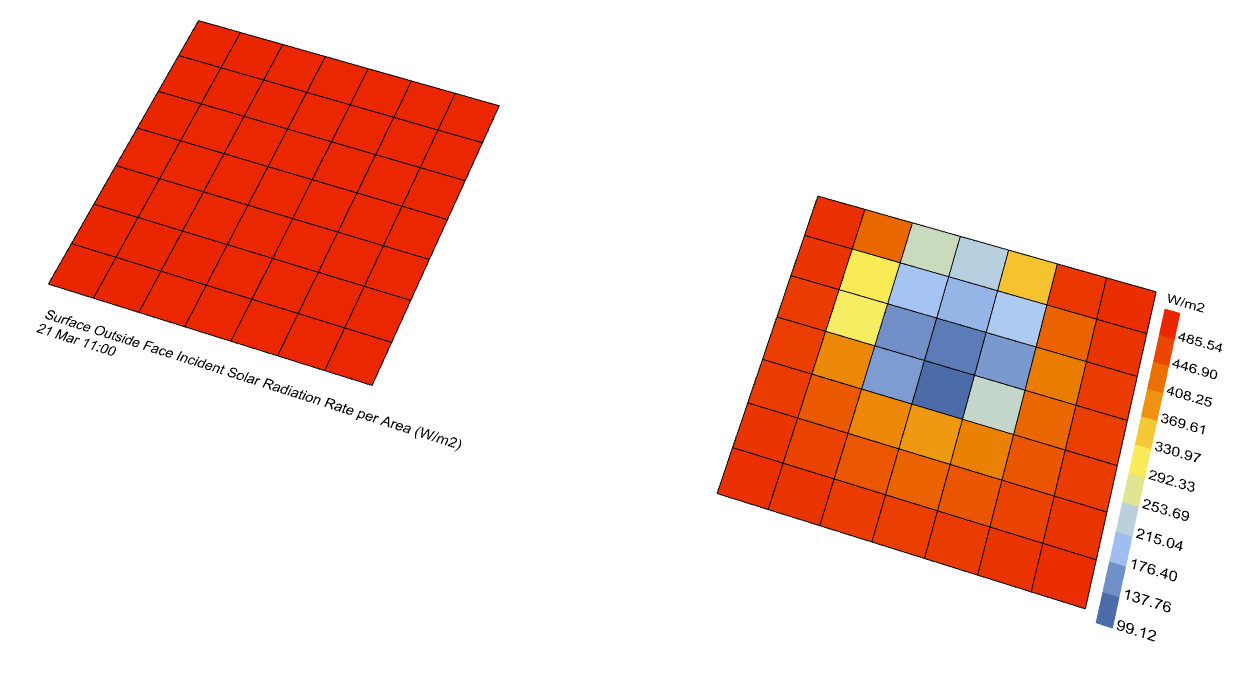
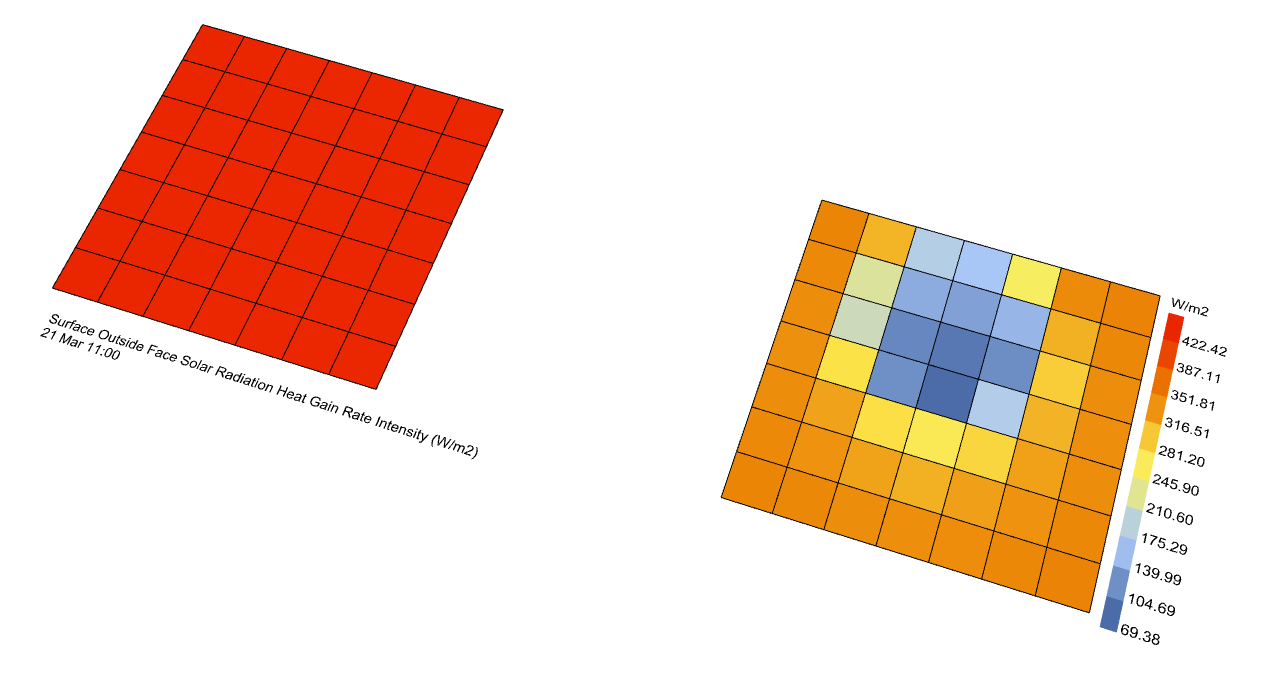
… and the solar radiation is clearly absorbed by the vegetation surfaces correctly:

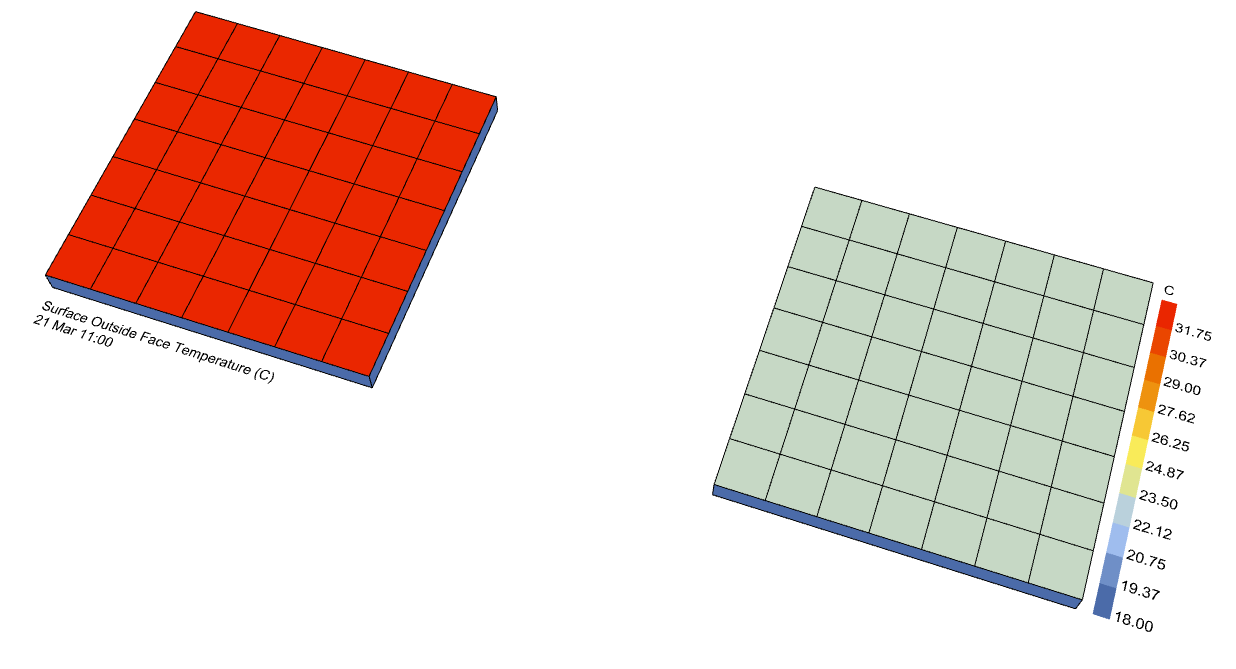
… but the temperature of the vegetation doesn’t seem affected by it:


UTCI_example_comfort_under_a_tree_with_visualisation_tools_LBTForum_CWM.gh (121.0 KB)

If I didn’t know better, I would have called this a bug in EnergyPlus but I think this is probably the vegetation material working as it was intended. I imagine that the developers of the model would argue that much of the absorbed solar radiation is shed through evapotranspiration of the plants, which we know to be partially true but it shouldn’t produce as uniform of a temperature distribution as we see coming out of E+. I guess this might just be one of those cases where we recognize that “all models are wrong but some are not wrong enough to be practical.” Clearly, the model is not as good as reality but I guess it’s “close enough” to be practical for lots of applications.

4 Likes

This is a realy nice discription! I will keep it in mind.