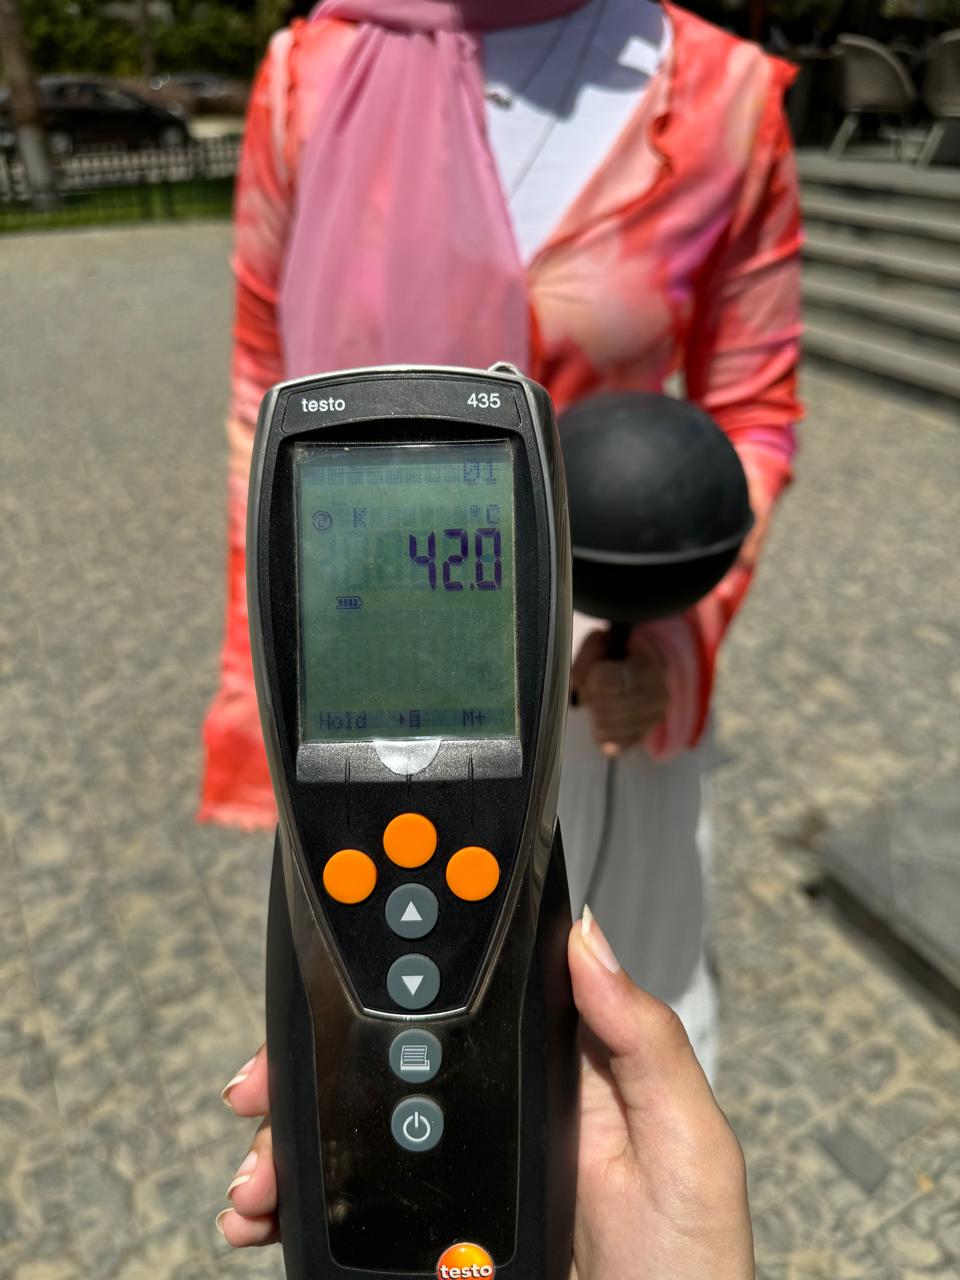
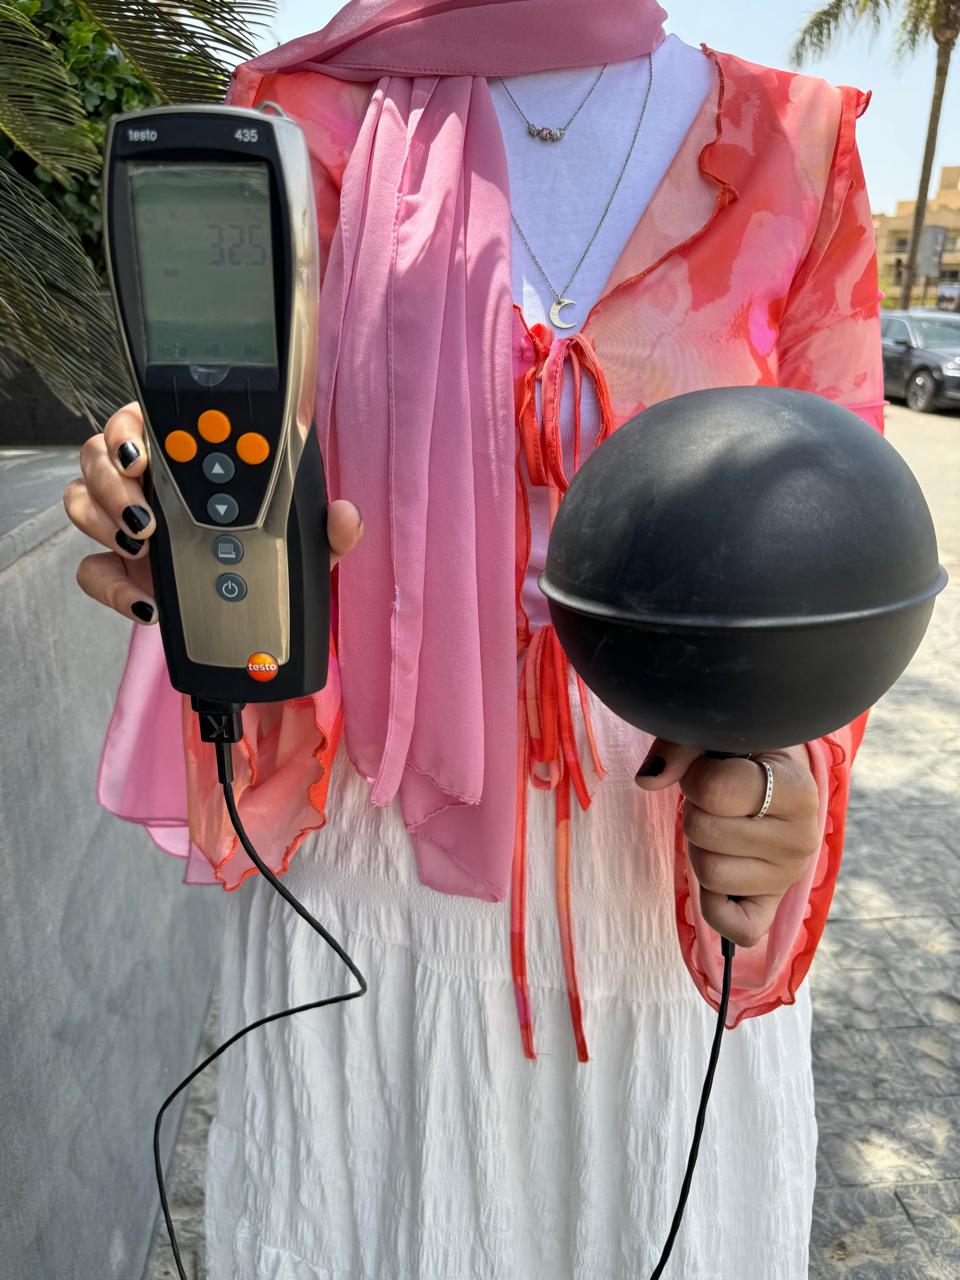
We have conducted a survey of an outdoor area in Egypt, identifying various types of finishing surface materials, such as marble and basalt. During the field measurements, the temperature of the basalt surface was recorded at 42°C under direct sunlight and 32.5°C in the shade. However, when we modeled this scenario using Ladybug and Honeybee, with specific parameters for basalt, the results were consistently about 5°C lower than our real-world measurements. I have attached the script and the Rhino model. Could someone please review and edit the script or advise on how to adjust the parameters to achieve results that more accurately reflect the on-site measurements?
The HB UTCI Comfort Map is NOT showing a map of surface temperature. It is a map of the UTCI or (in your sample file) the Mean Radiant Temperature experienced over the geometry of a human subject. These two are very different things.
Also, you just used the OneBuilding climate file as your starting EPW. If you wanted to do a calibrated model, you would have to match the conditions of your real-world experiment with the EPW data you are plugging into the UTCI map.
Thanks, @chris , for your reply. It means a lot to me. I have already conducted field measurements, and the readings are attached in the JPEG. We used a globe thermometer to measure the Mean Radiant Temperature (MRT), and we modeled every detail as it is on site, including adding a layer of material specifications. However, the simulation results are consistently off by about 5°C. How can we update the attached script? I think the script is missing a component that can resolve this discrepancy.
The pictures are helpful, @Tarekkamel_1988 , but it’s still unclear which two temperatures you are comparing to one another.
Are you comparing the globe thermometer temperature to the simulated MRT from the UTCI map, which is over a human subject? These are still very different things. Globe thermometers are trying to give you an estimate of operative temperature, which is roughly an average of MRT and air temperature. But a globe geometry and a human geometry are different. So there’s always going to be some error in the globe’s ability to approximate what a human feels. This is true even if you try to match the globe’s surface area to volume ratio with that of a human, though you can get some good agreement between MRT derived from the globe temp and the longwave portion of MRT by matching surface area to volume.
It might help for you to look through this example of a deconstructed thermal map to get an understanding of all the different parameters (and types of temperatures) that go into the output of the thermal mapping recipes. I know I’m using terms like “longwave MRT”, “shortwave MRT Delta”, and “Operative temperature” without defining each of them.
And, all of this aside, you’re not going to be able to compare a simulation to a real result unless you are creating your own EPW with the air temperature and radiation values that occurred at the time that you took the globe thermometer readings. For example, how do you know that the EPW data in the TMY file you are using isn’t for a day with much different cloud cover from your test conditions?
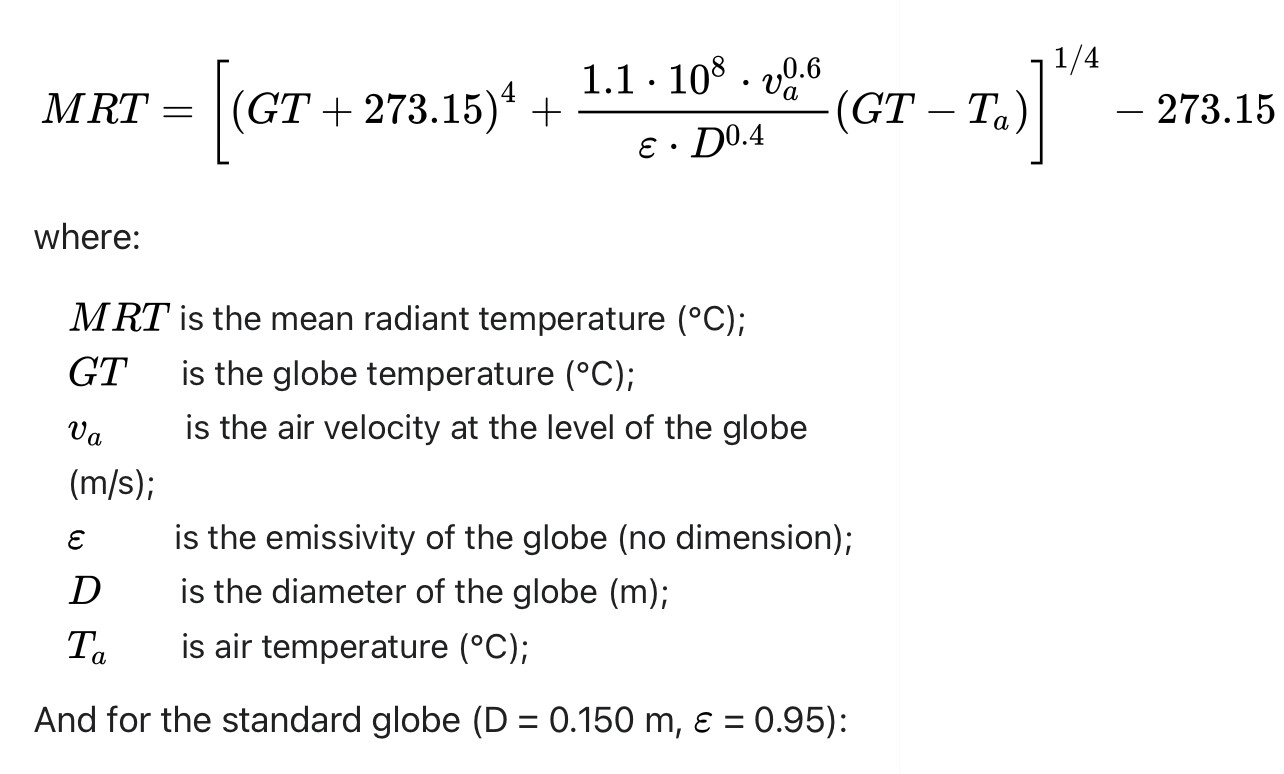
This is the most common formula to get MRT from a globe thermometer.
If you already have measured air temperature, wind speed and relative humidity, you can now calculate both MRT and UTCI out of your readings.
But then if you want to compare with Honeybee, use the EnergyPlus Converter to morph your readings into the weather file. E+ converter is typically found in your E+ installation folder on the C drive. Here I mean a version of E+ that you installed yourself as a stand alone installation, not that one installed with Open Studio.
Thank you, Professor @YASSER_IBRAHIM , for your reply. I would like to confirm my understanding of your feedback:
The attached previous picture (which is took by me) is not the MRT but the GT, which stands for Globe Temperature. Therefore, I need to use the attached equation to complete the missing data for air temperature, emissivity, etc., in order to calculate the MRT. This is necessary for measuring and calculating the MRT in real-life scenarios.
However, when I run the same model in LB&HB, I should follow the second method, which involves using the E+ weather converter. This method is not clear to me. I do not understand which EPW file should be imported into E+ and what extension should be exported. Additionally, I am unsure how to use the exported data to deduce the MRT.
I would like to simulate the MRT of the model street using LB&HB. Could you please outline the process to achieve the MRT results? Alternatively, could you help me by editing the attached previous script?*