Hi all,
I’m trying to a outdoor thermal comfort analysis and everything seems to be correct. However, I’m using a grid to analysis a series of points and was wondering if there is a way to extract the extreme values, both the lowest value and highest values on each point on the grid?
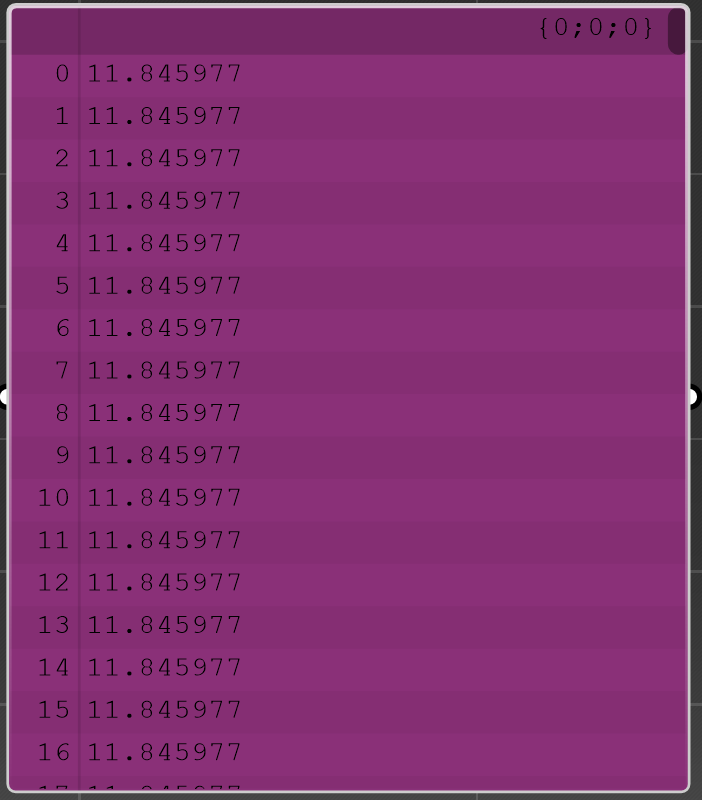
At the moment I’ve only managed to extract the average value of each point, but when I attempt to extract the grid points extremes, they all show the same value which I assume isn’t correct, as each locally defined value should have there own individually localised high and low values.
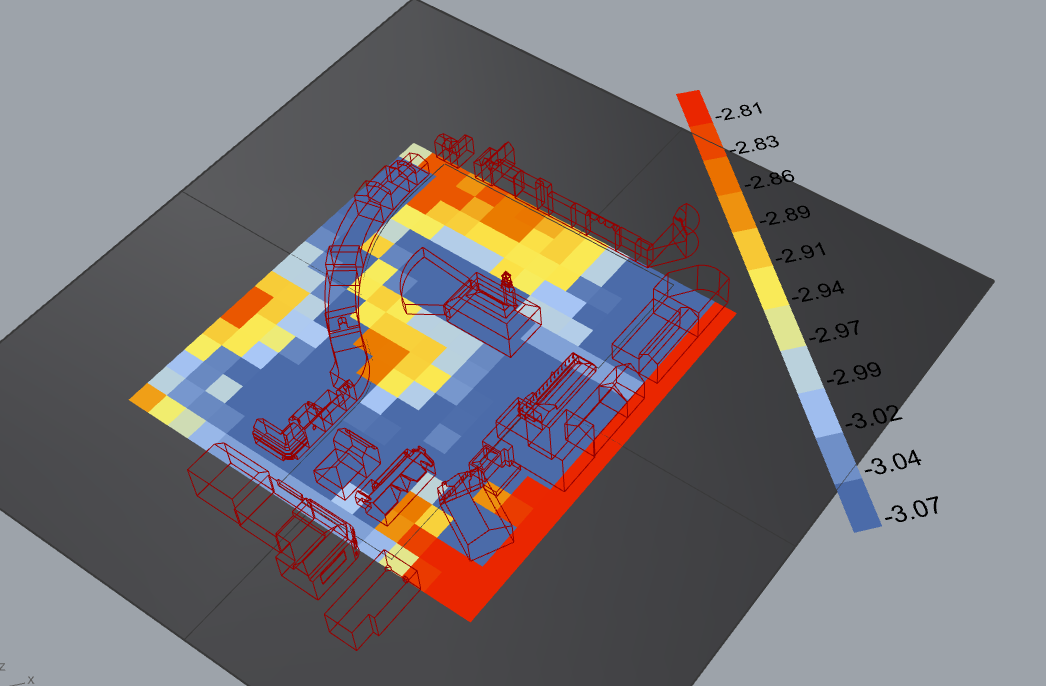
This is what the average looks like:
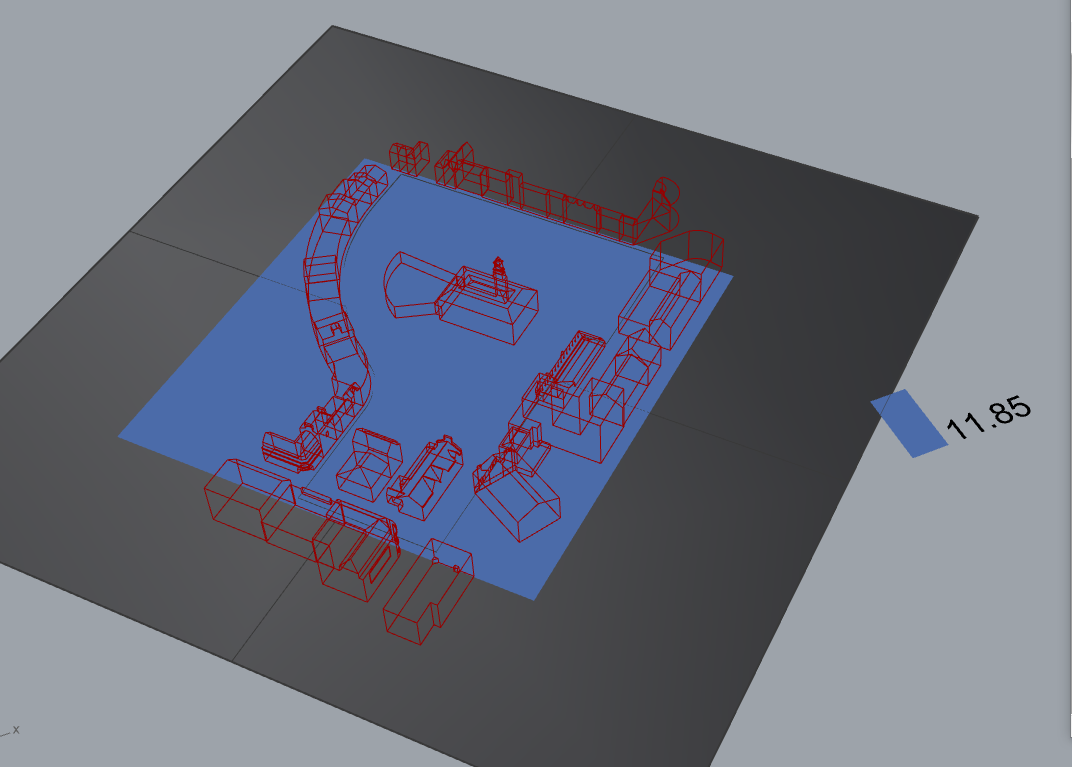
This is what the highest values look like:
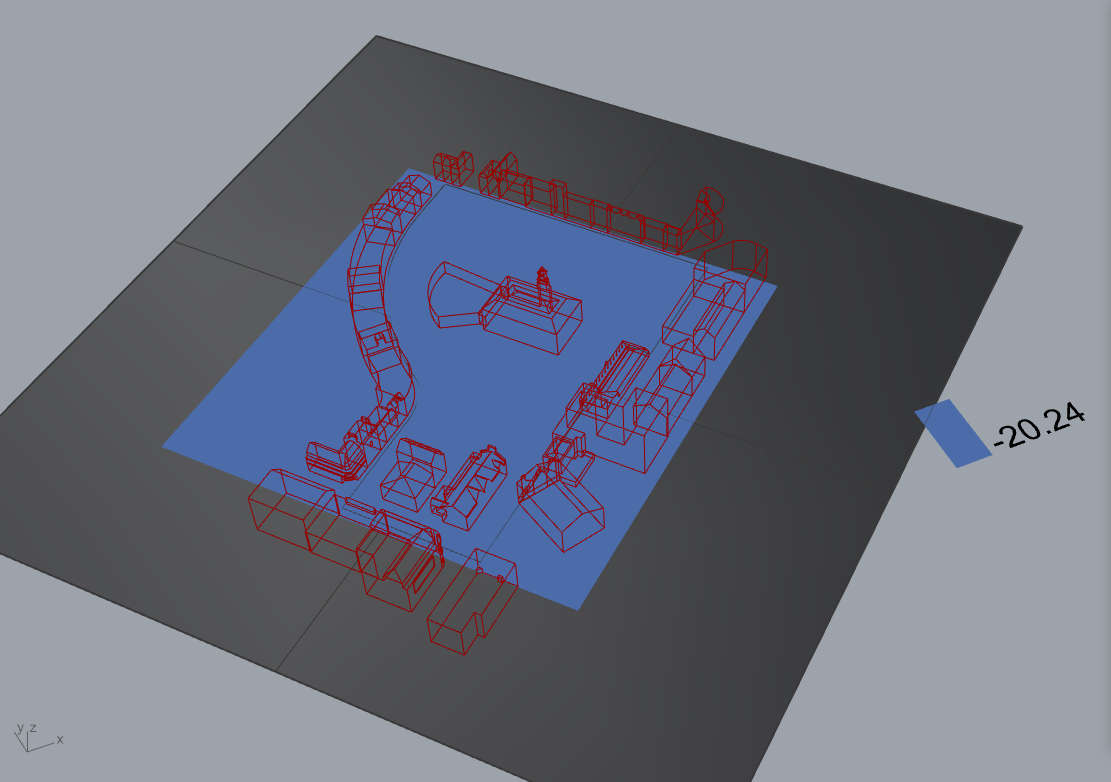
This is what the lowest values look like:

GH Script:
https://drive.google.com/file/d/1BdNGC0a_Btu8VfPJbMFtdtrEl-UGvZxQ/view?usp=sharing