Overlay Humidity Data as Gradient on Monthly Temperature Plot


Trying to create something like this. I used the LB Monthly Chart component but can’t figure out how to use the RH values as a gradient overlay.
Would appreciate any input on this issue. Thank you.

2 Likes

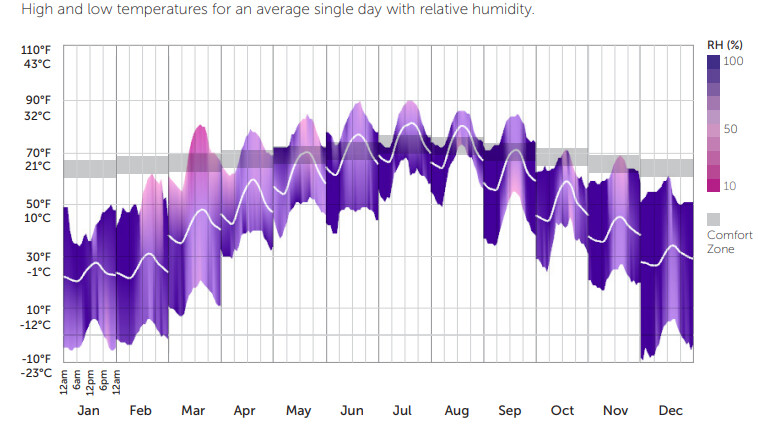
In case anyone is trying to do the same, I exploded the mesh and colored each face of the mesh based on RH.

1 Like