I want to understand a bit more how the peak irradiance works with the HB Annual irradiance recipe.
I want to understand if the values that are then displayed on the heatmap are:
all occurring on the same day (which would potentially be the cooling design day)
the peak value for each point throughout the whole year, meaning that they could potentially happen at different timesteps
I think the way this should work is 1), but I have the feeling that the way it actually works is 2)
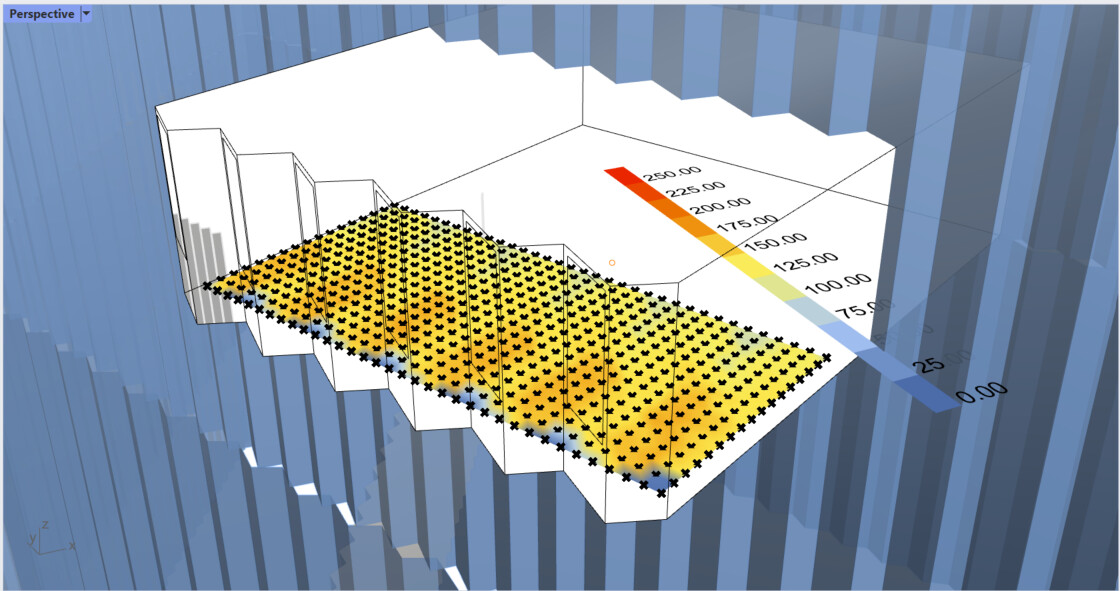
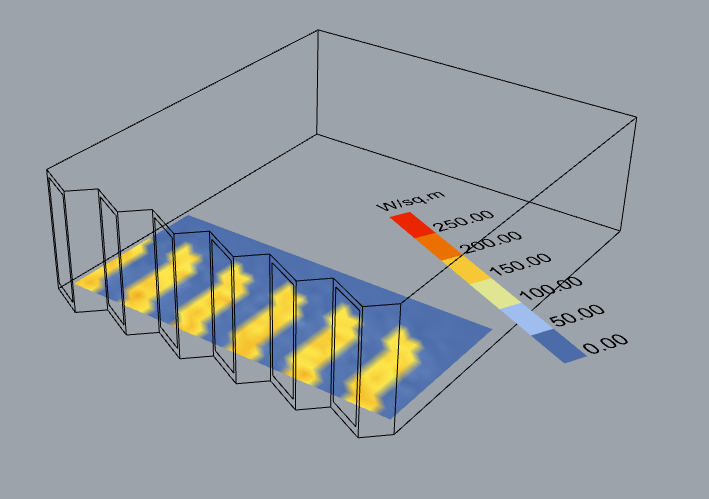
Looking at this picture for instance, I would expect the blue-ish portion to be deeper. The only way I could explain that limited effect of the lower spandrel on the peak irradiance values, is that actually the sun vector hitting each point is corresponding to the sun being in different positions in the sky, so that every time the peak value is obtained (which would be incorrect).
I have just displayed the peak irradiance according to 1) (by recording all the values of solar irradiance on the floor plate and searching for the maximum) and this is what I have obtained.
You are correct that it is number 2. The value is just the peak that each sensor experiences over the whole period of the Wea that you input.
You’ll see that you can get the other one with a little bit of data processing but option number 2 is also useful. If you want a streamlined workflow for option 1, I can add a coincident_ option to the HB Annual Peak Loads component that returns the conditions of the coincident peak of each sensor grid over time.
Hi @chris, thank you for clarifying this.
I agree with you that option 2 is useful too, but I reckon 1 should be included as well as it’s more realistic.
I’ve been working for quite a while on overheating prediction strategies and a set of guidelines from the Australia Green Builidng Council suggests measuring the peak irradiance on the floor plate and make sure the floor-average peak irradiance (on the cooling design hour) is below a certain threshold.
For this reason I think it’d be great to have, as you said, a coincident_ option.
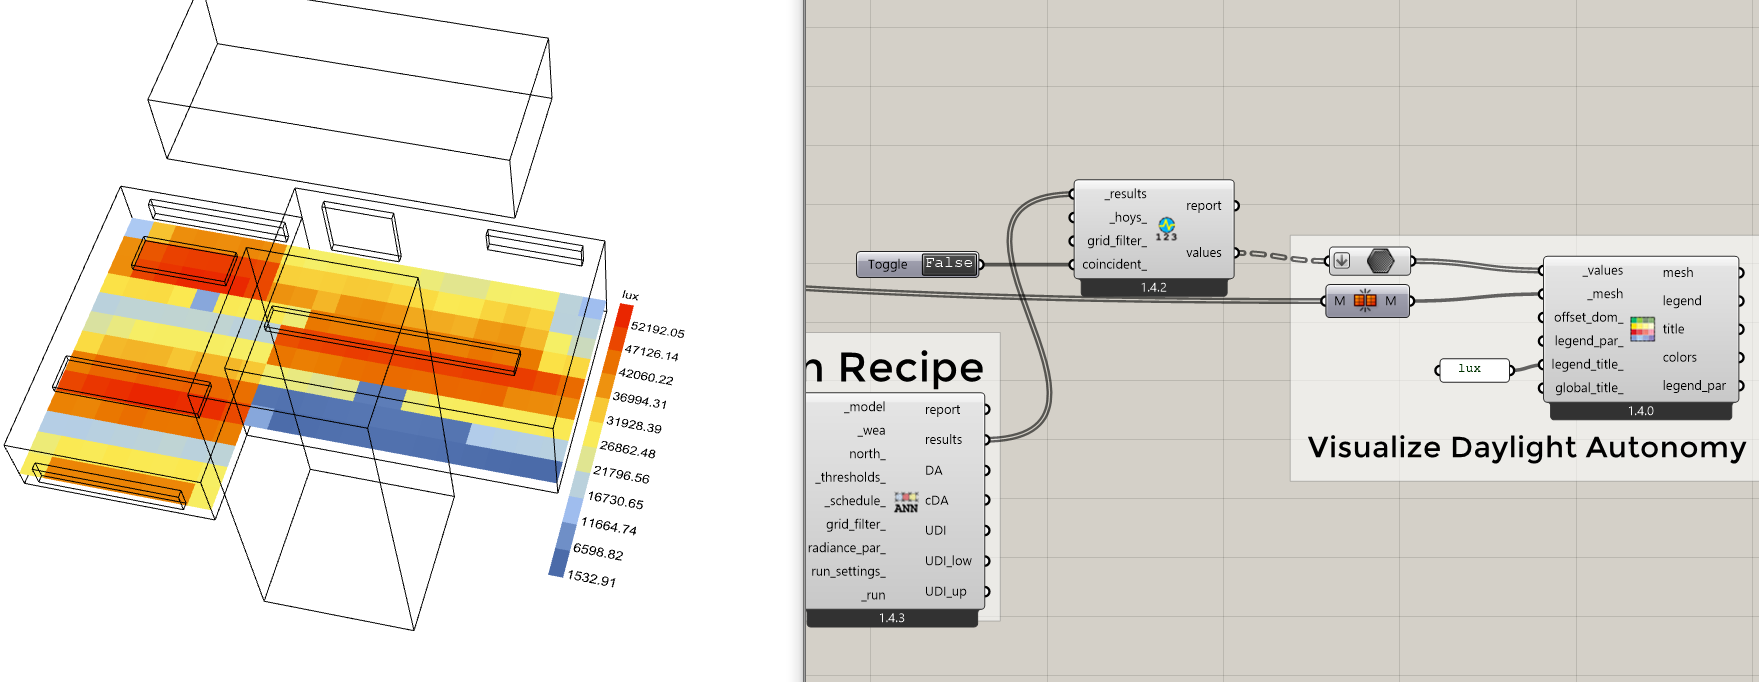
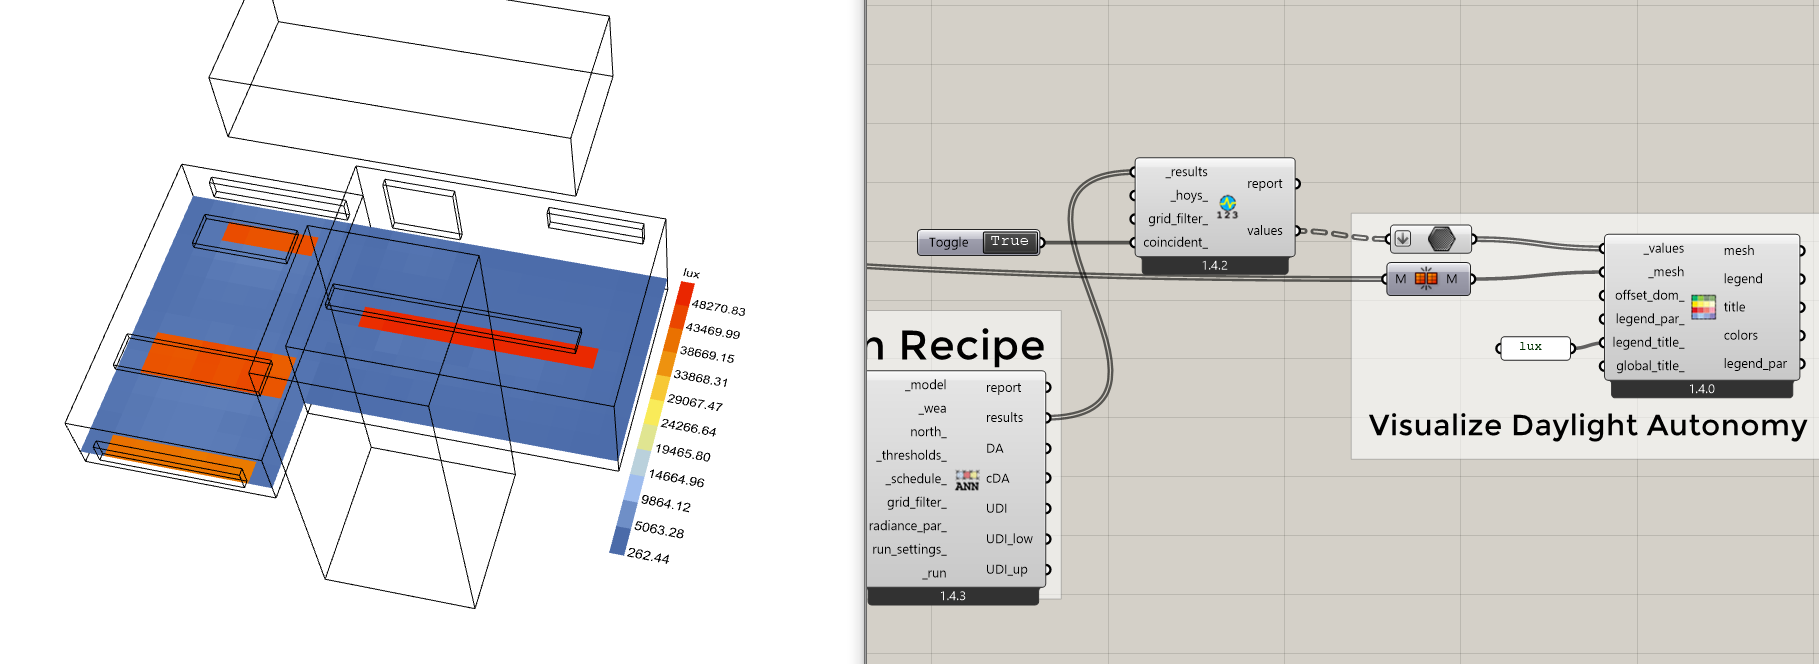
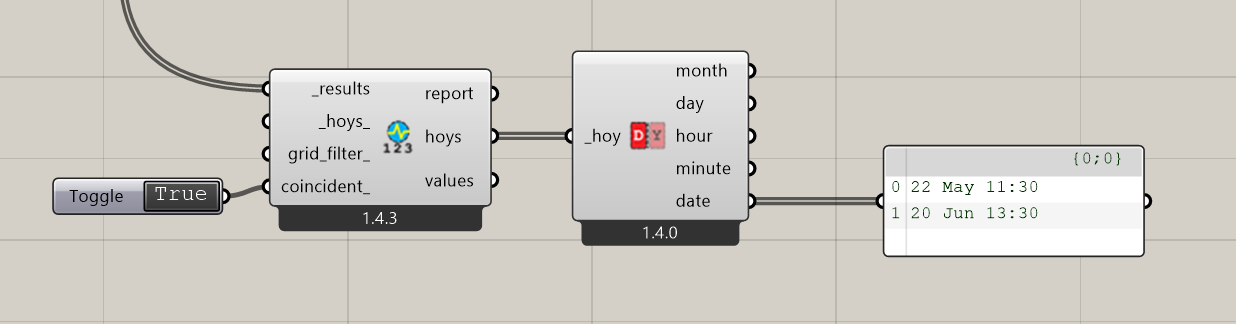
I am just letting you know that I added an option to get the coincident peak, which show the maximum value over a whole sensor grid at a single timestep.
These two screenshots illustrate the new capability.
Thanks @chris, that’s excellent news, glad you managed to do that. May I suggest to include, as an output, the date and hour during which the peak occurs for the coincident option? This is quite useful for example if you want to compare a baseline with other design alternative solutions always during the same timestep (so you’d get the date of the peak from the baseline, and apply it to other cases). Let me know what you think about it. Best. Adam
Hi Chris,
Thanks for this function I was looking for since a while!
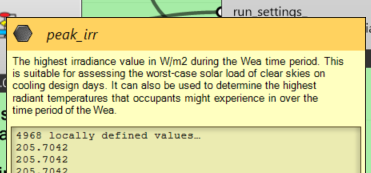
Maybe a small suggestion : in LBT 1.5, the HB Annual Irradiance has a output peak_irr, which seams to give out the 2), but whose definition is rather the 1)
Would it be possible to make it clearer for users in this description (or maybe to give out the 1, which is in my sense for “tangible”).
Thank you!
I understand that this new version returns the max. value over a whole sensor grid and the timestep at which this occurs. Would it be possible to return also the max. delta between values and the timestep at which this occurs? Same assuming a whole sensor grid.
I am working in a project in which I’d like to extract max. differential radiation over a surface and timestep.