Hello everyone,
Is it possible to plot the % shading on the stereographic diagram like what ecotect use to do.
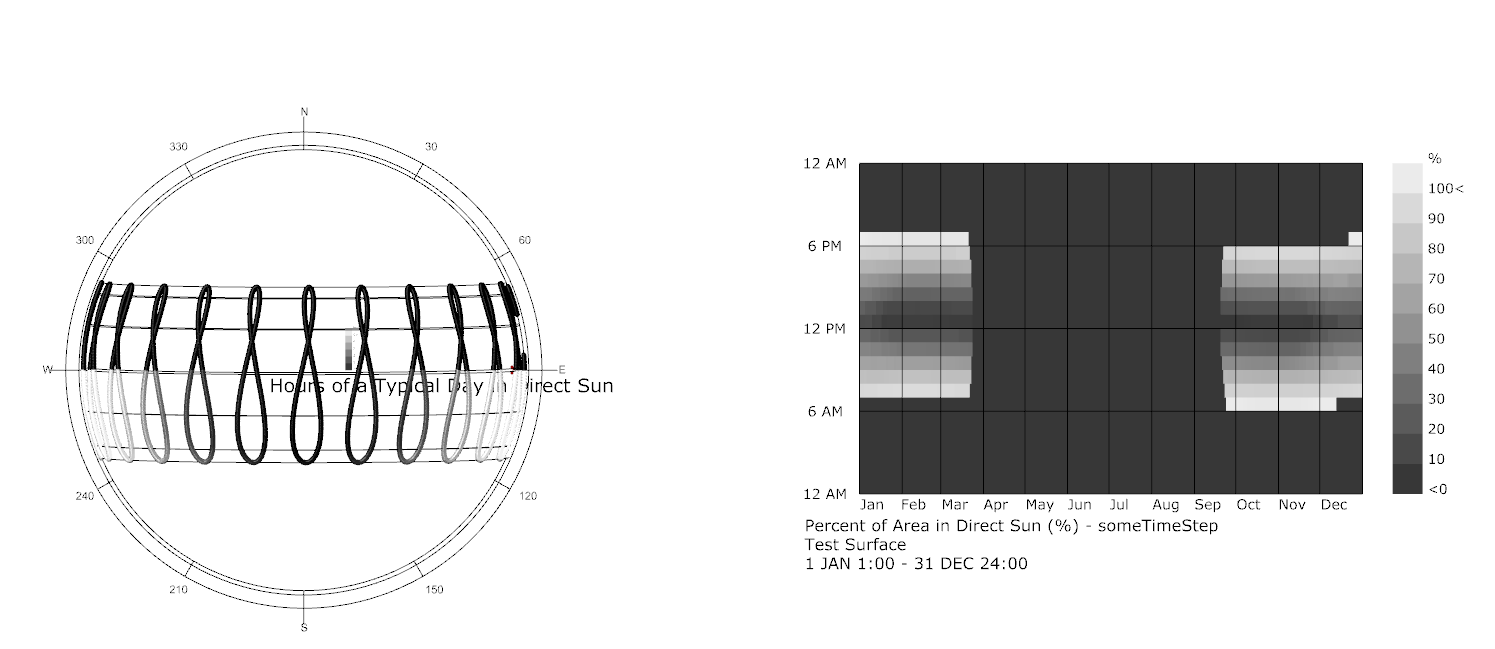
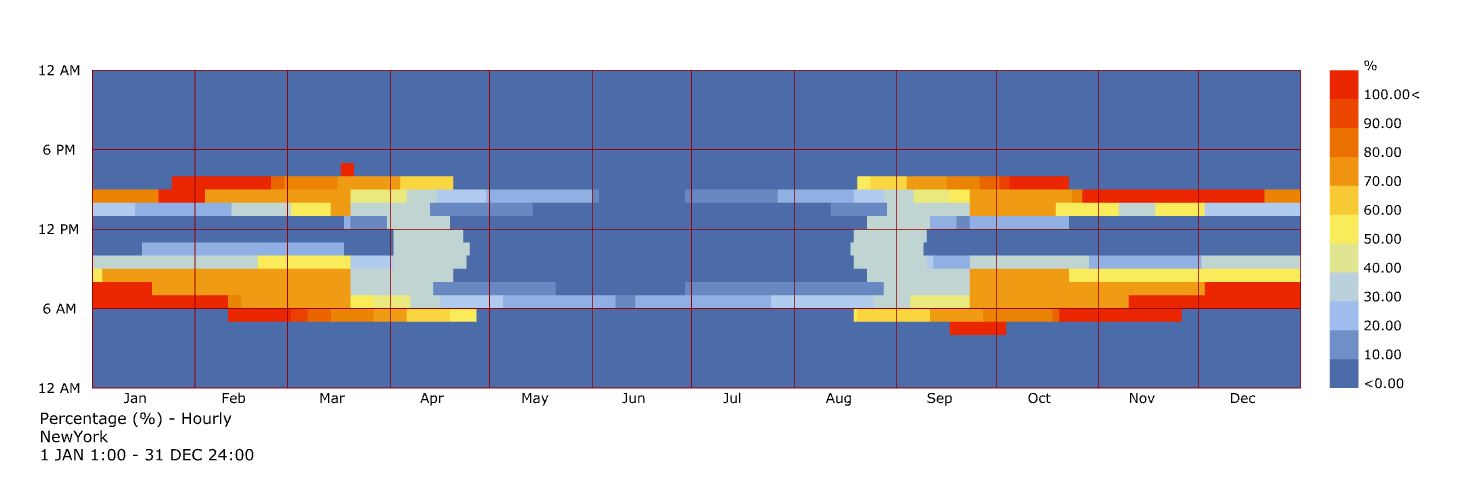
I am aware we can do something like this which is certainly helpful as well.
Any help/hint is much appreciated.
Regards
Saket
Hi Devang,
The one you sent me is a simple shadow mask.
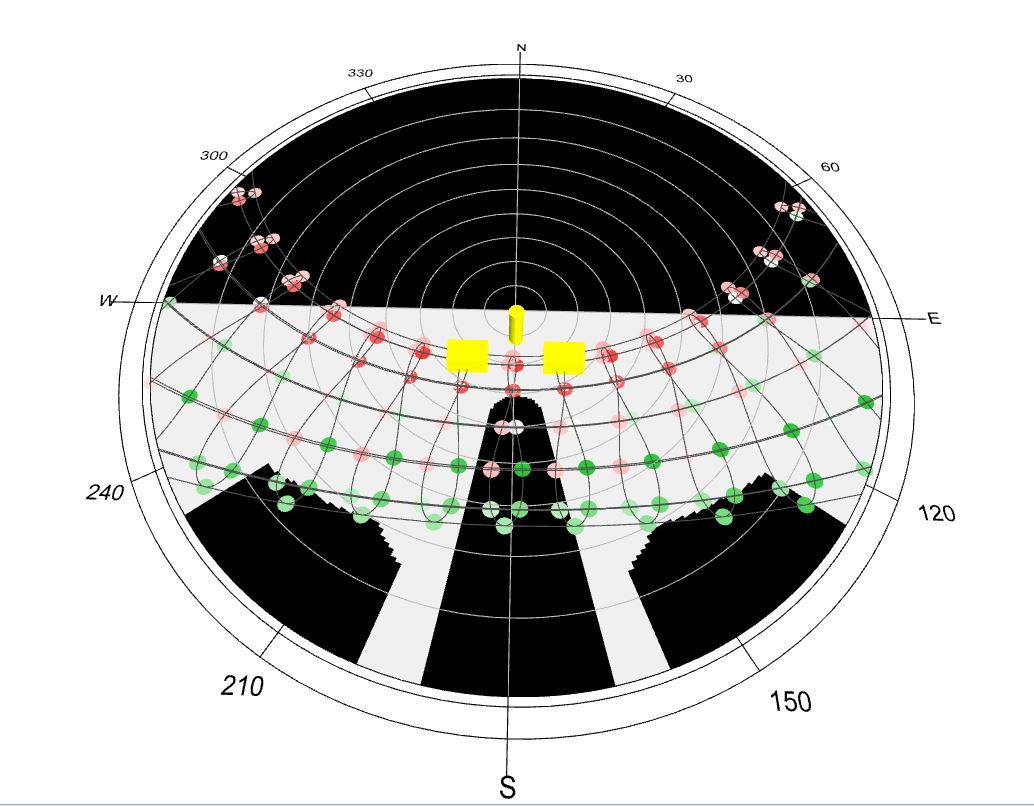
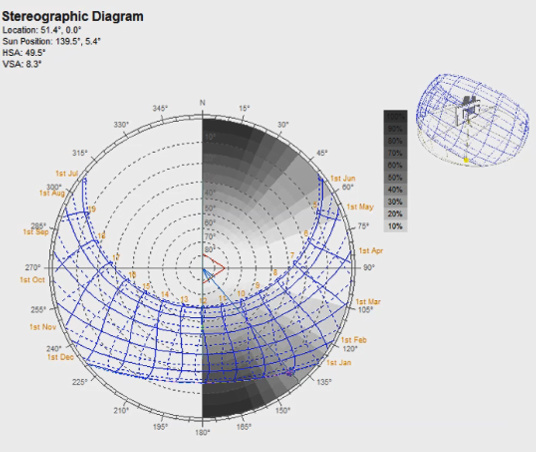
If you look carefully at the image above, the stereographic sunpath will show you at each hour of the year how much window area is shaded in % and is plotted on the sunpath itself.
I wonder if we can do something similar using ladybug.
Perhaps something like the Ladybug_SkyDome but instead of radiation values we can assign custom values (in this case % shading)
Now I understand what you are trying to do. Yes this will be quite helpful. I have something in mind. Will share in a couple of hours
You can do the following:
The script by Chris on hydra gives all the numbers including plotting them on the 3D chart.
http://hydrashare.github.io/hydra/viewer?owner=chriswmackey&fork=hydra_2&id=Estimate_Glare_Potential_Over_a_Year&slide=0&scale=1&offset=0,0
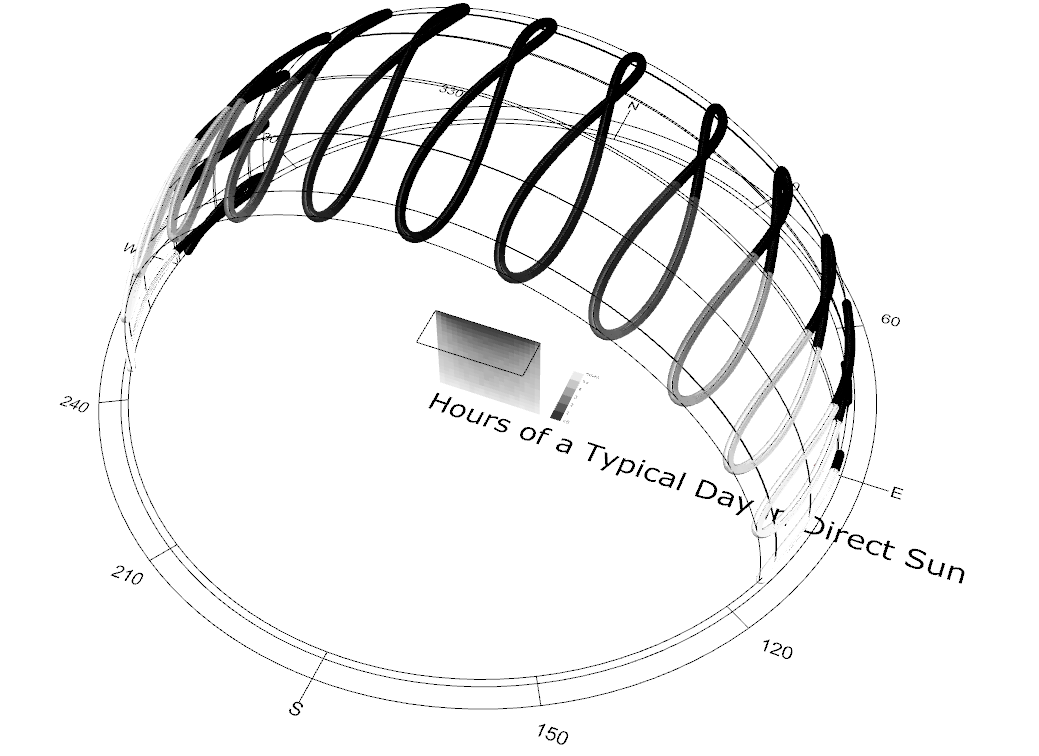
Colouring the suns is a way
The annual chart is certainly easier to read. However, it does not reflect the physicality of the area in analysis wrt orientation the way ecotect would show. If we can somehow colour directly on the sky dome that would be awesome.
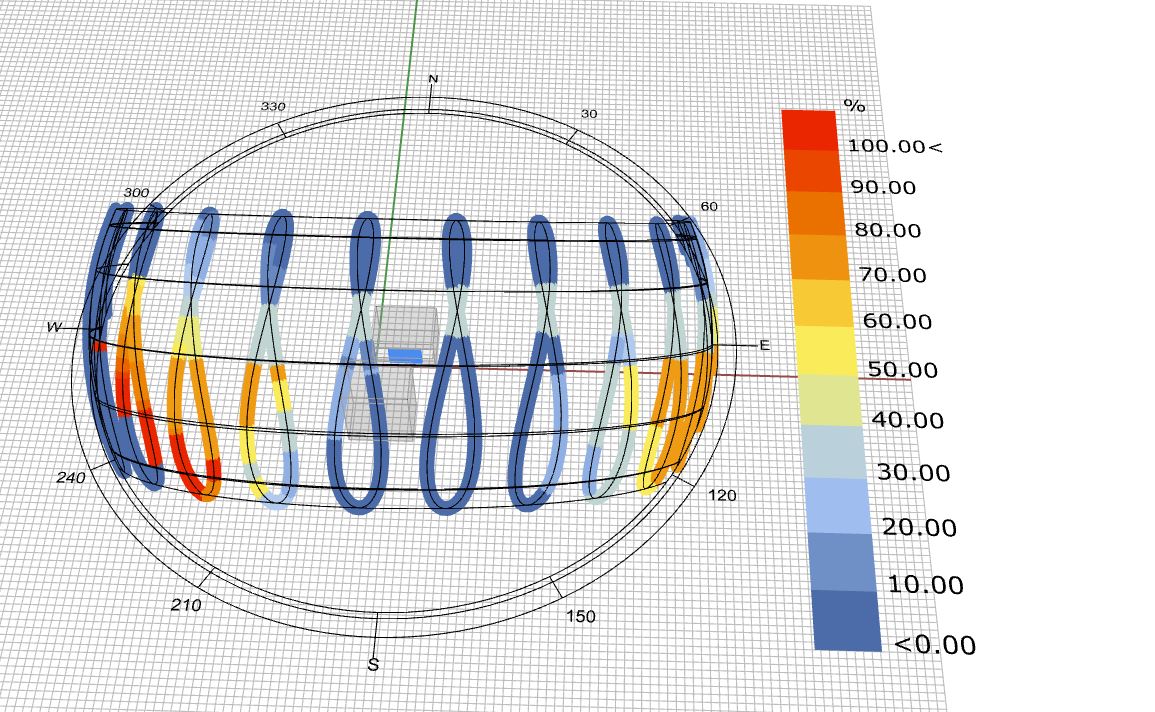
Here’s What I mentioned. Suns shaded as per percentage of window shaded
shading percentage.gh (463.8 KB)
@SaketSarupria and @devang:
Just take into account that the display (ecotect’s or LB’s in the above cases) is for ONLY one point (probably the center of the window). You need to be careful with that. If you want to get results for two or more windows, the display will look different and probably misleading.
Like @devang’s file  , even though i see some strange behaviors in the 3D chart, that from the images of the model are hard to explain.
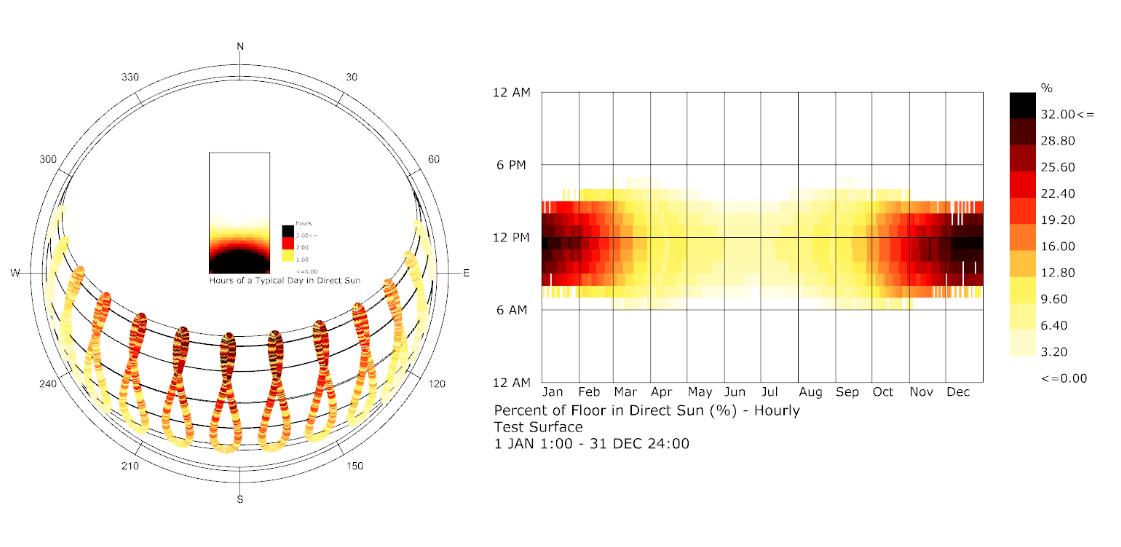
For speed sake i will do this analysis for one representative day for each month.
-A.
Hi Abraham,
I agree the plot has to be of one representative window only. I could not understand your comment about center of the window. The window surface has an analysis grid and that’s why there is a % of area shaded value instead of saying 100% or 0% (which would have been the case for just one center point).
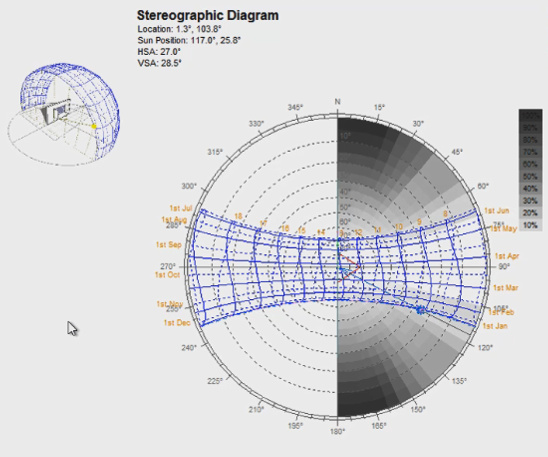
My initial question still remains - can we plot custom values on the sky dome - in this case % of window area shaded. Here is another example for better clarity.
I could not understand your comment about center of the window. The window surface has an analysis grid and that’s why there is a % of area shaded value instead of saying 100% or 0% (which would have been the case for just one center point).
You are right. You get the average of the grid point for the specific window. Which in this case is fine, considering that the average is calculated for each hour separately.
My initial question still remains - can we plot custom values on the sky dome - in this case % of window area shaded.
I’m afraid not. It’s been a while since i used Ecotect, but this visualization looks like a sky mask rather than a sun exposure/occlusion hours. Am i right? Otherwise i can’t get how you get shades of grey where the sunpath is not covering the sky dome.
-A.
From what I understand the skydome with the shades of grey (without the sunpath) is a representation of % area shaded if the sun was located on a particular point, which means it is location independent.
The second thing ecotect did was to overlay the sunpath for a specified location. For a particular time of the year one can find out how much % area would be shaded simply by looking at where the sun would be positioned on the stereographic chart on the overlayed sunpath and what is the corresponding % shaded value at that location.
This is what I think the diagram represents.
@SaketSarupria,
I believe you are wrong. The reason you see the nice grey degree is because, for your case, it is a window with some amount of test points (like the grid divisions in LB). Then the sky is subdivided in patches, and then there is an average between the test points exposure to each sky patch (hope i’m clear in the explanation). The shades of grey represent the amount of sky occluded/exposed. Then we are talking here about sky exposure and not sun exposure. Moreover, for the test point you want to check you can see in the sunpath itself if you are getting or not sun rays at different times (you can check this in Ecotect by moving the blue dot in the sunpath diagram. You’ll see that nothing changes.
In short, this is not the kind of analysis you are asking for. Beyond that, @devang’s example is the closest result you can get … in LB.
Hope this makes sense for you.
-A.
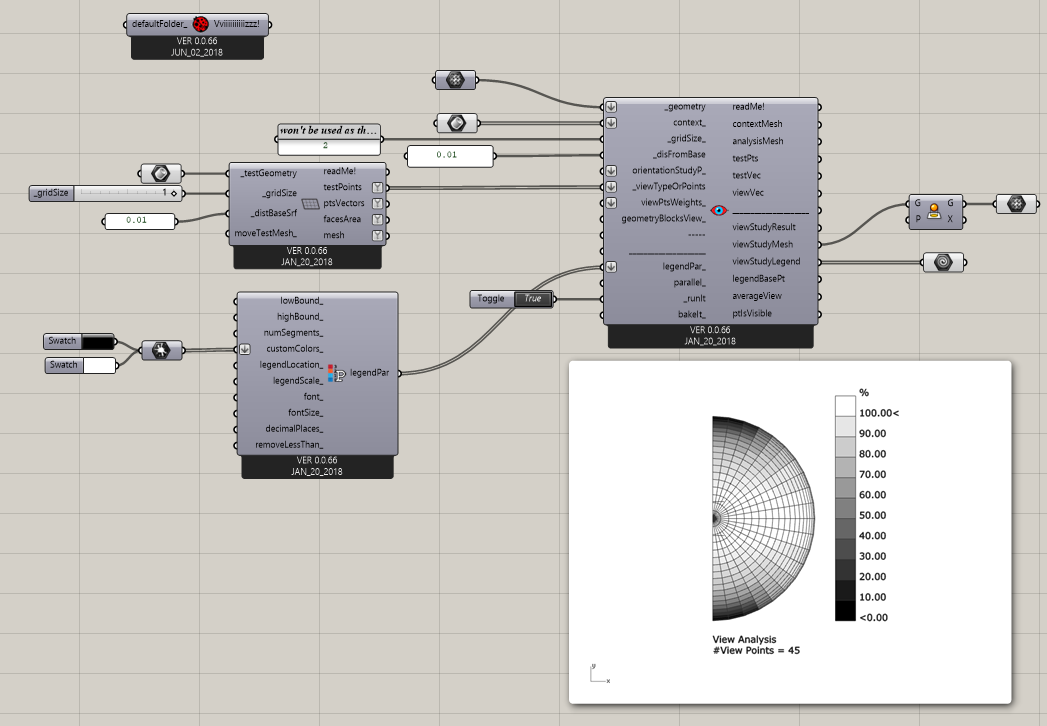
I might be wrong but I think this diagram has nothing to do with sunlight hours. Also the sunpath doesn’t make any differences to the results. It’s there to be. The results are most likely the averaged view from window to each sky-patch. You can create such a graph with a simple Grasshopper script or by using Ladybug’s view analysis component. Here is a quick try. I didn’t try to solve the projection but that’s not hard to do.
view_to_sky.gh (396.4 KB)
I see that my response was messed up during the editing. Sorry about that. Basically i said (and agree) with Mostapha’s comment.
-A.
This explains it clearly. You are certainly right. Its the averaged view from window to sky patch.
Great! Thanks a lot @mostapha
Legend as always!