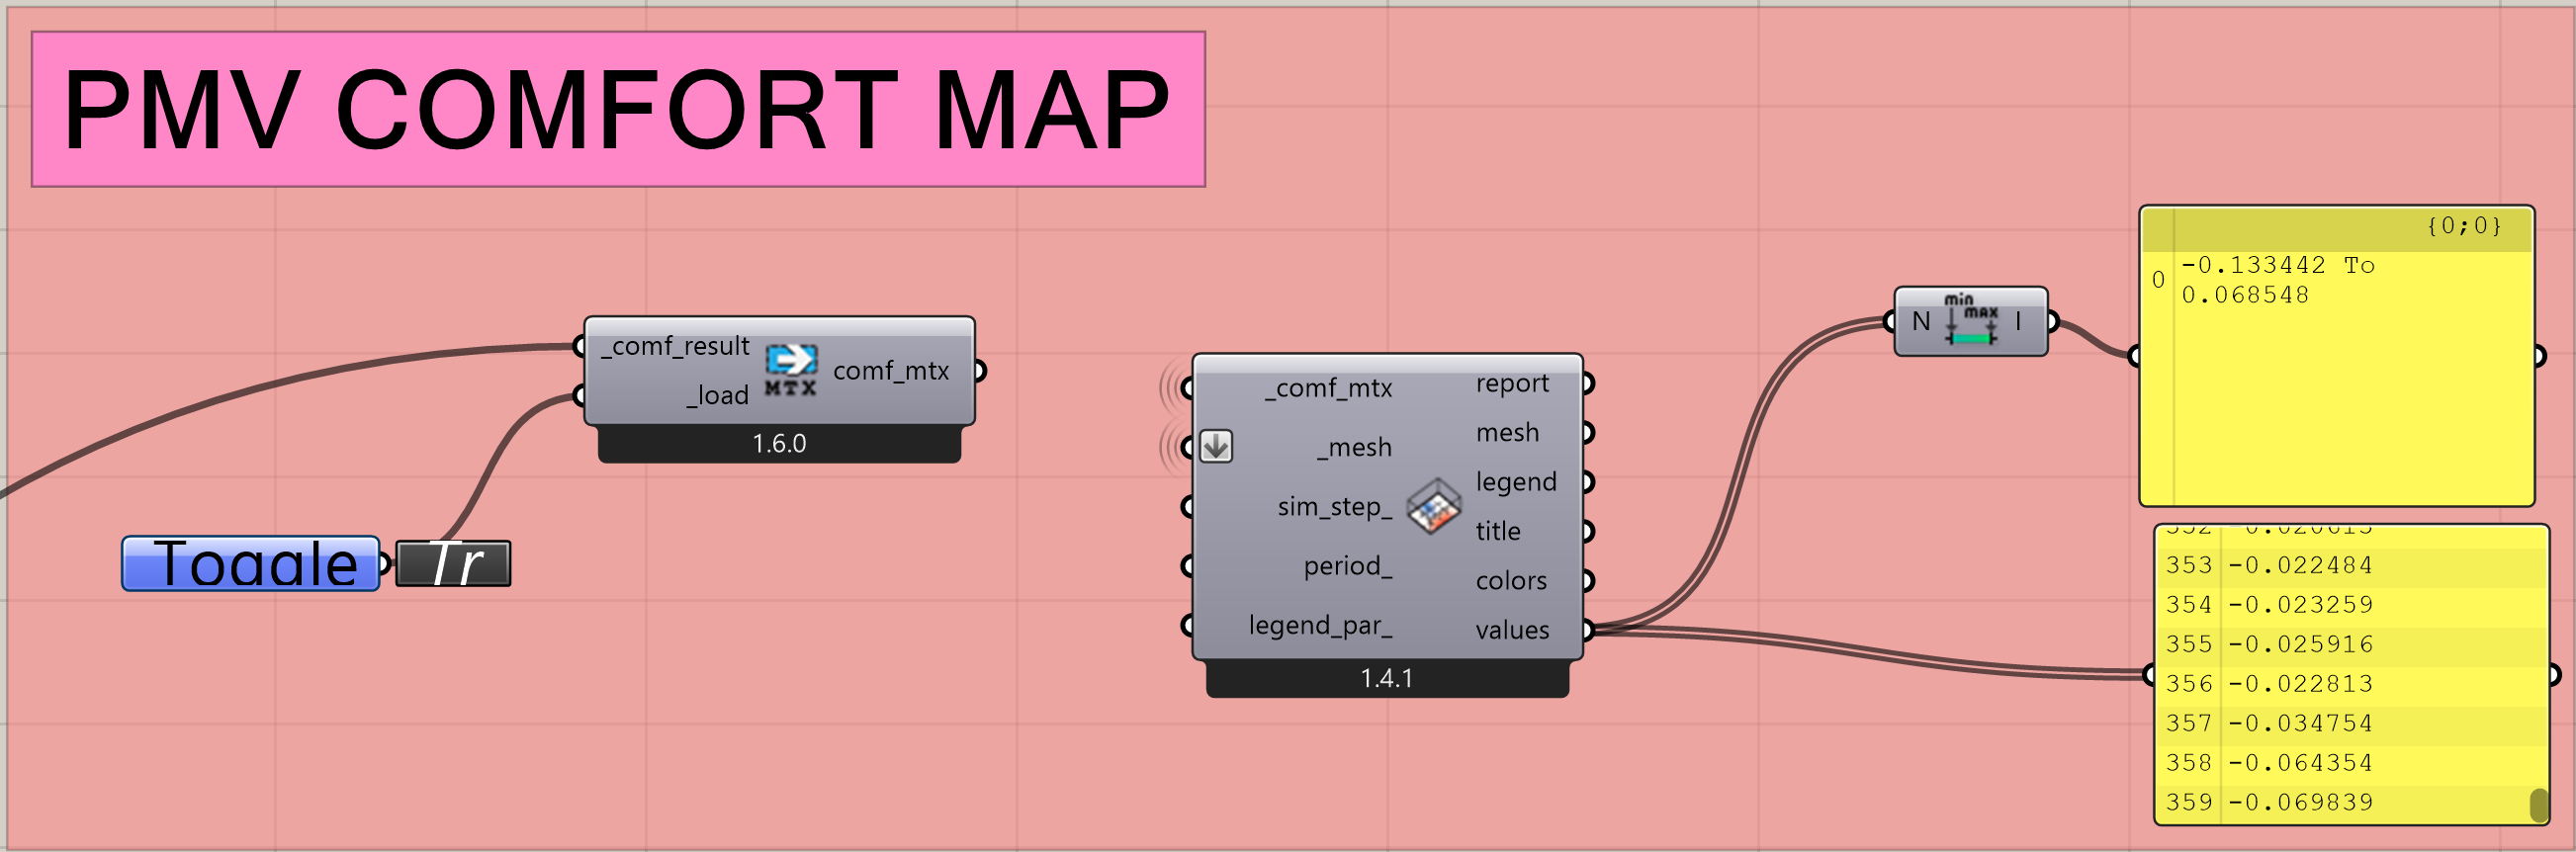
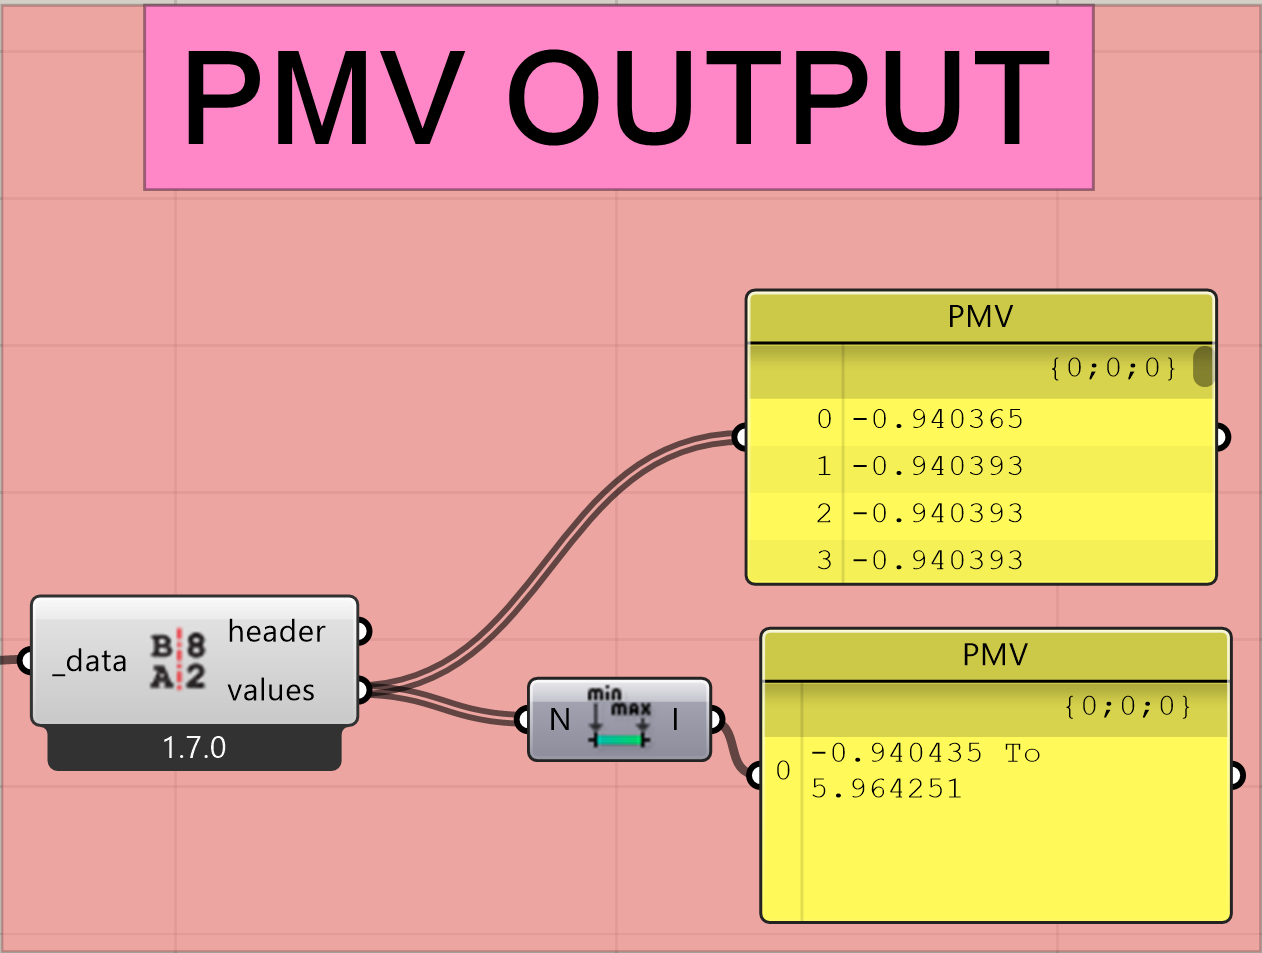
Could someone please explain to me why the results of the PMV comfort component differ from those of the PMV comfort map? Is it possible to attain similar values?
I intend to utilize the GH script to indicates ASHRAE Standard 55 compliance within the range of -0.5 to 0.5 PMV scale. However, due to the varied output results, I am uncertain about my compliance status.
The comfort mapping components run an energy simulation to determine the thermal conditions of the space at every hour. They also run detailed Radiance calculations to determine the view factor from each sensor point to each Room surface, which has its temperature computed in the energy simulation. This way, you get a detailed picture of longwave MRT with the comfort maps. Lastly, the detailed comfort maps run a Radiance simulation to determine shortwave solar radiation that can fall on occupants or be reflected off surfaces towards occupants.
You can try to do all of those complex comfort mapping steps yourself before you plug the final MRT into the PMV Comfort component so that the results of the two match but you’ll need a lot of components to pull that off. It’s far more efficient to just use the thermal map.
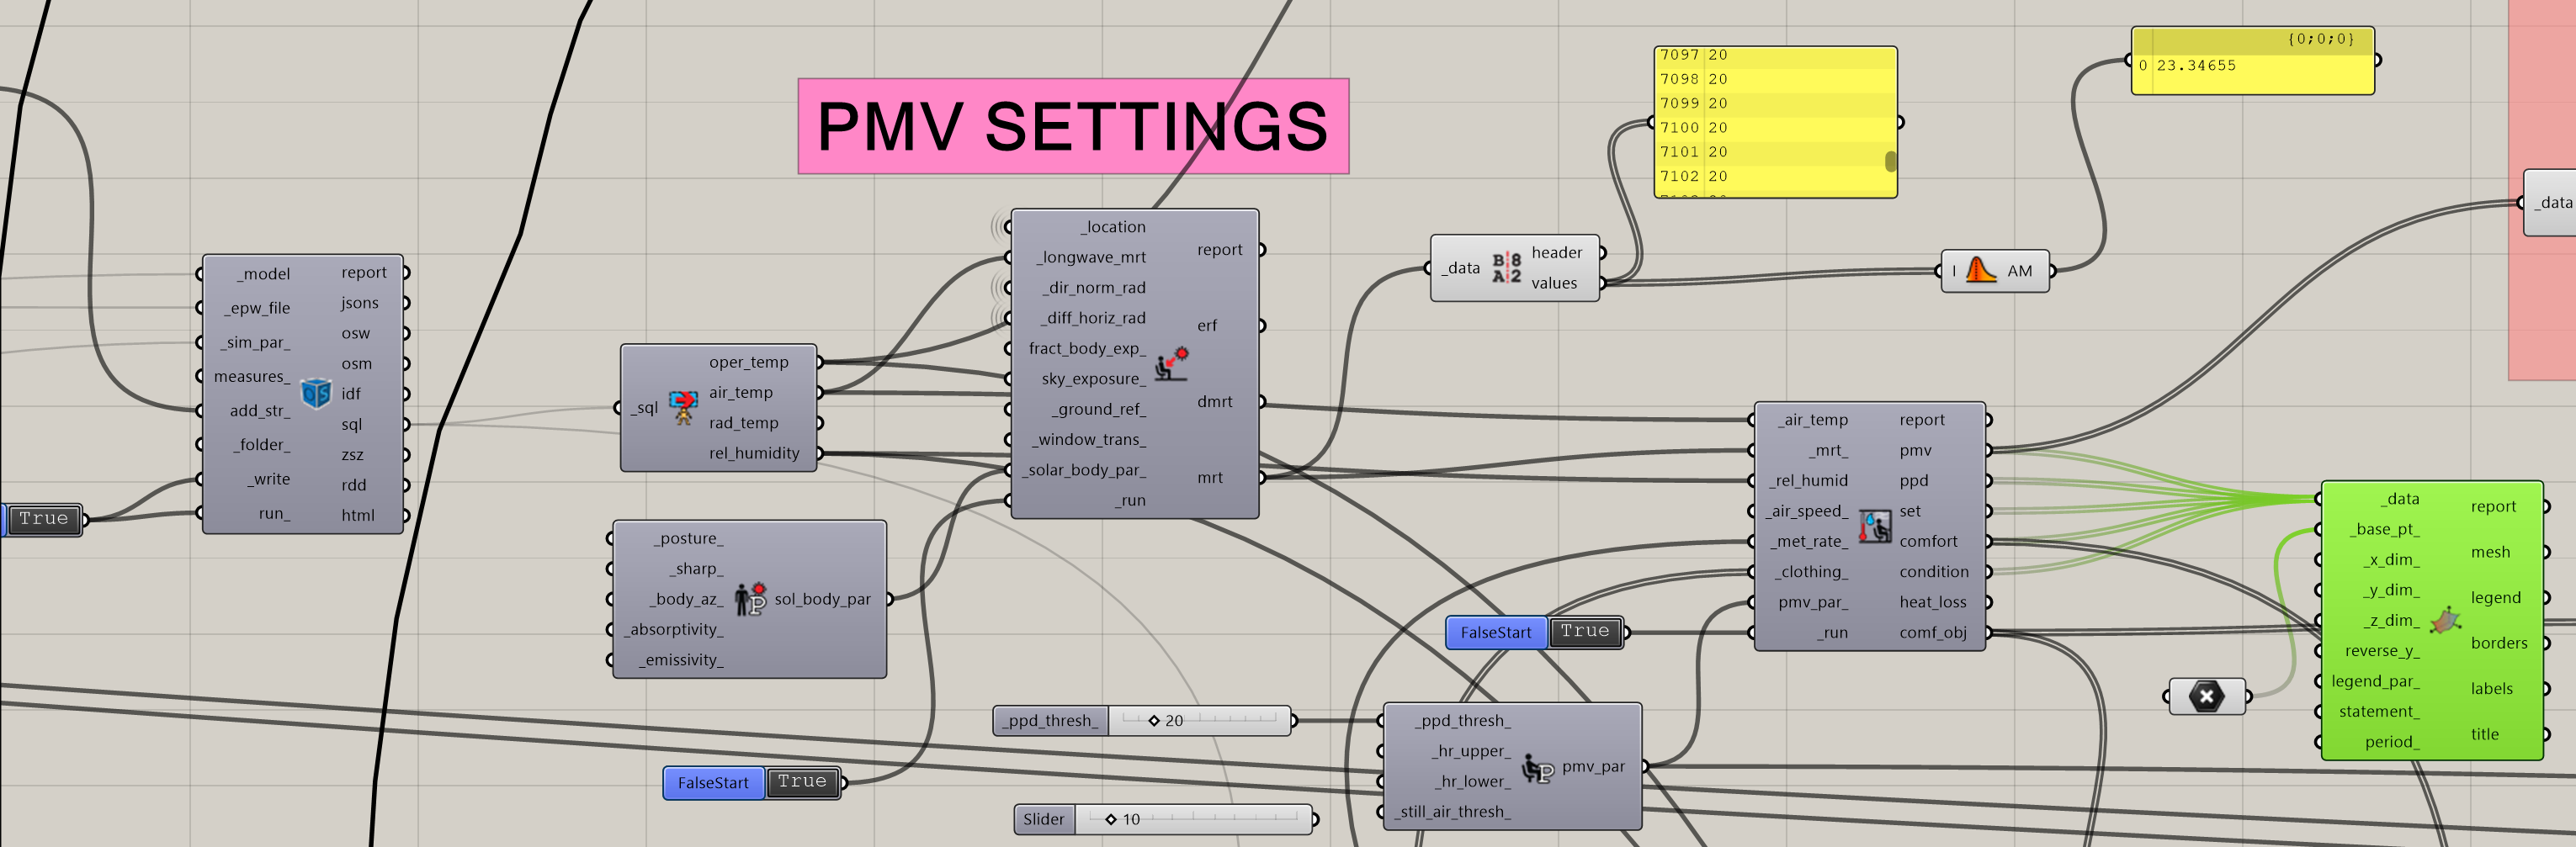
Thanks a lot for the detailed explanation of the HB “PMV” COMFORT MAP component. I got the difference between the components but I still have a couple of questions. Since I’m analyzing the PMV model, I would like to analyze it with the CLO value according to the season. Currently, I’m using the LADYBUG CLOTHING FUNCTION, but it’s not working effectively.
How can I generate a single PMV model map that considers the CLO seasonality?
To check compliance with Ashrae 55, how can I verify the PPD % from the HB “PMV” COMFORT MAP?
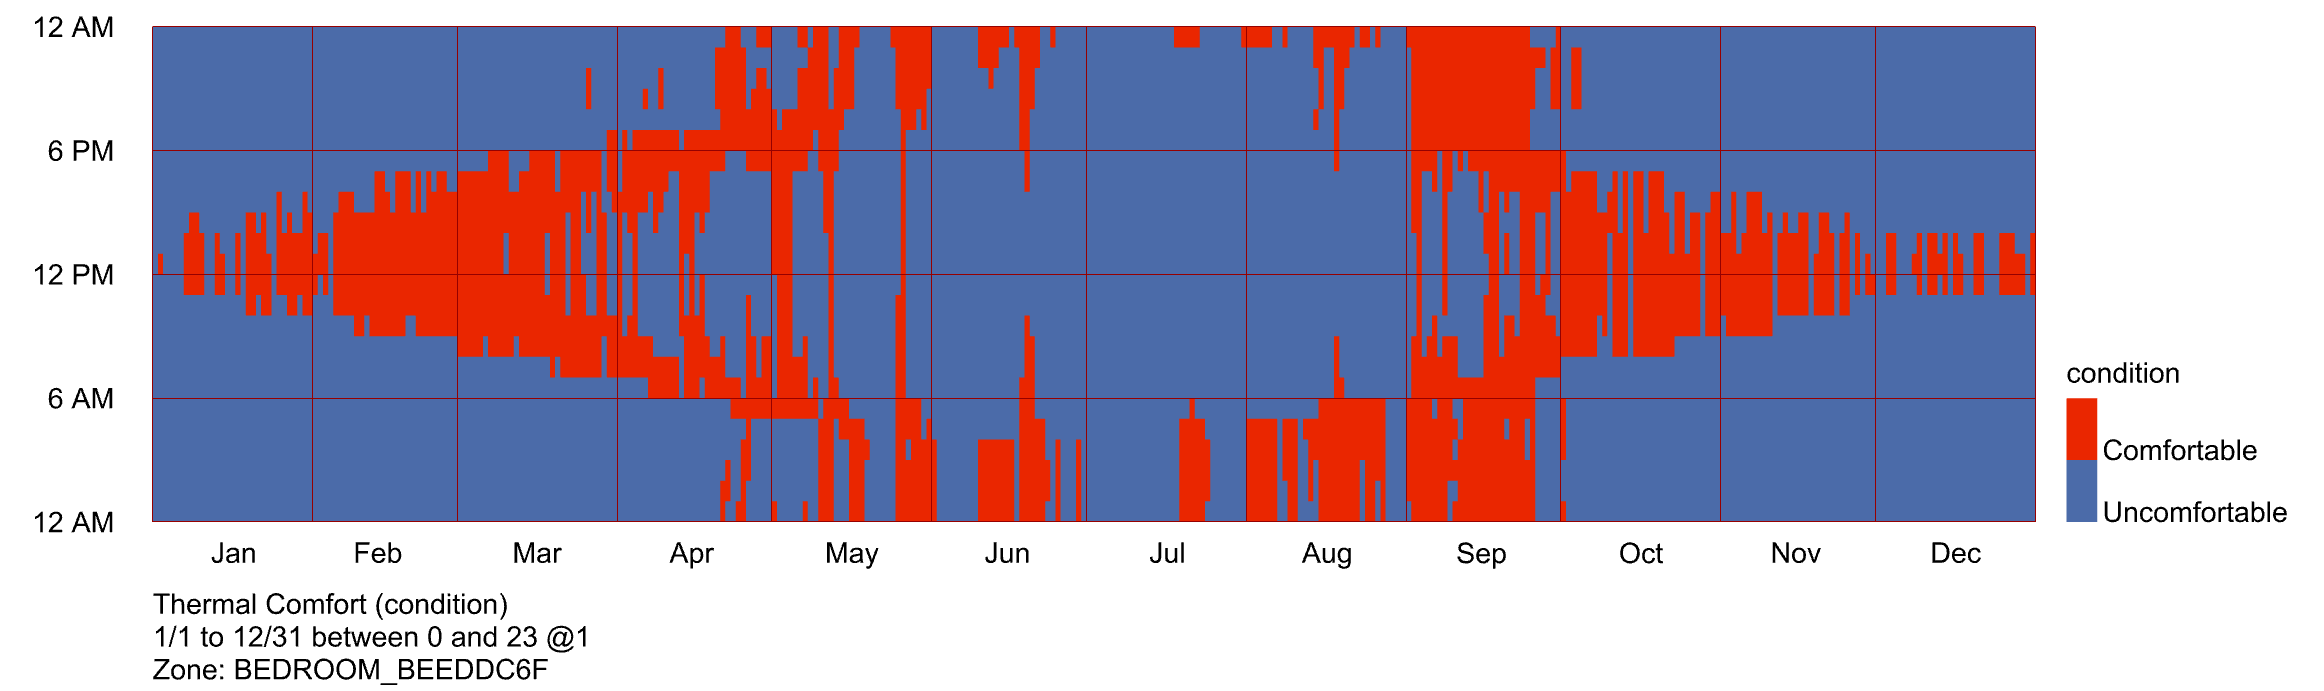
Can you specify the components I should incorporate into SQL + LB INDOOR SOLAR MTR + LB PMV COMFORT to produce the graph that aligns with the HB “PMV” COMFORT MAP?