Hi,
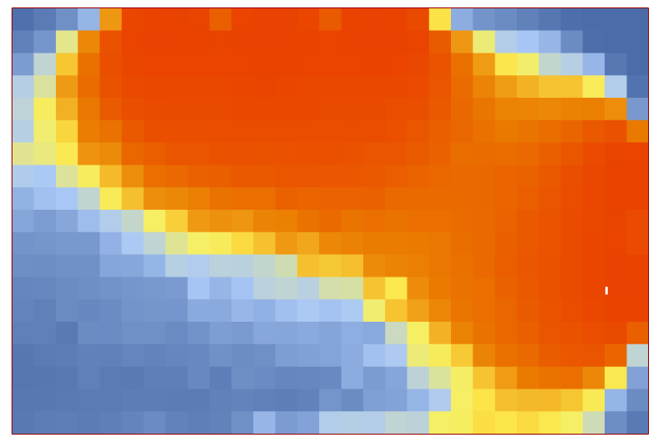
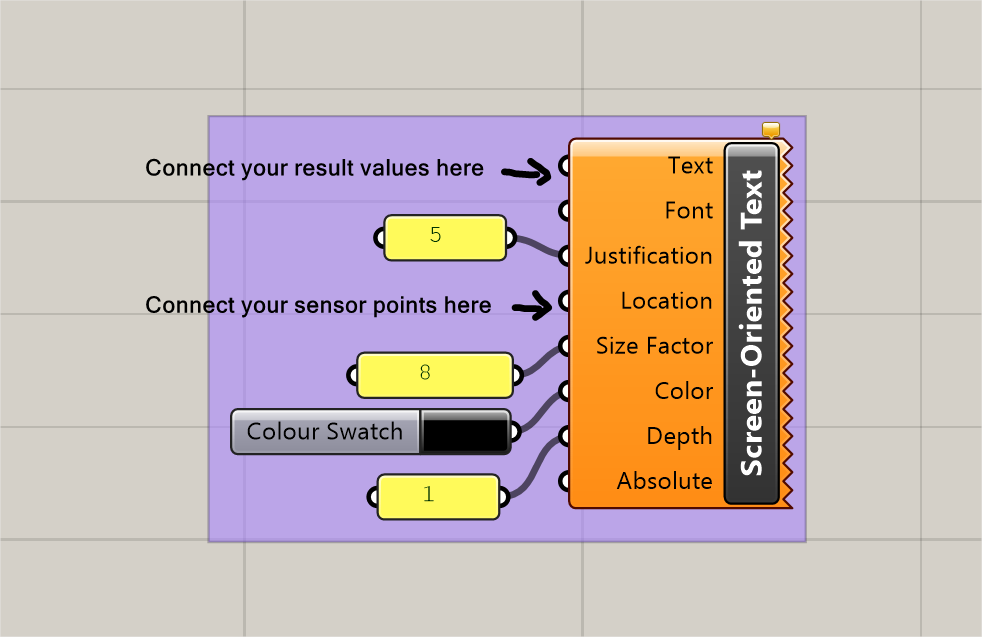
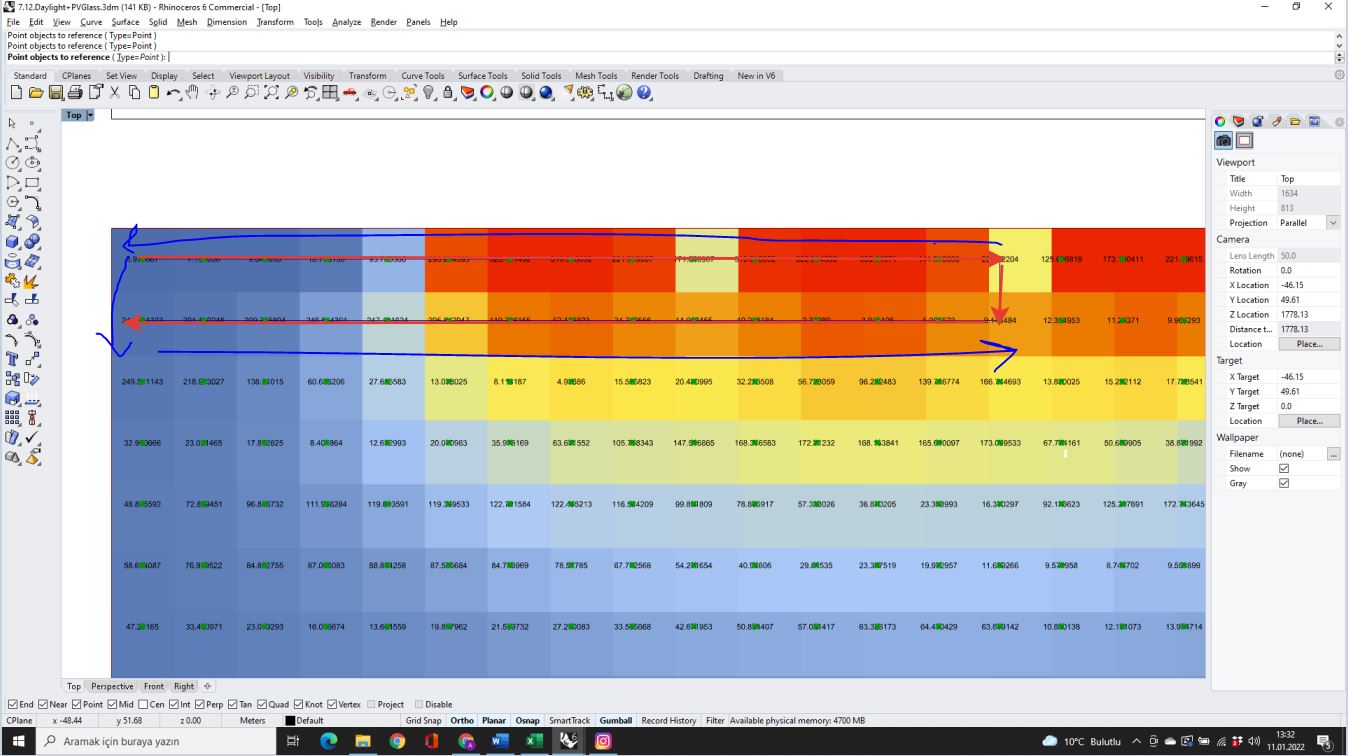
I am currently working on a point-in-time daylight analysis of a room for a specific day and time. On the heat map, I can see the colorful results and its legend, but I actually need to see the exact illuminance level (lux) of each sensor. I can get the results and export them as an Excel file but I cannot differentiate which sensor has which illuminance value. Actually, it would really be great if I can see illuminance values written on this heat map visual.
Is there any solution or idea regarding that? I would really appreciate your suggestions. Thank you.
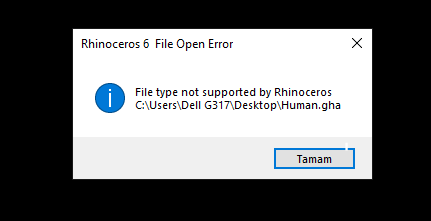
Seems like you are trying to open it directly on Rhino, thus the error.
Try opening Rhino and Grasshopper first, then drag and drop the “human.gha” file into the grasshopper canvas. That should fix it.
I´m also attaching the Human version I´m currently using, if it doesn´t work with yours try it out…
In addition: another method would be to copy the “human.gha” file manually into the Grasshopper Components folder, which can be found: C:\Users\Your_User_name\AppData\Roaming\Grasshopper\Libraries
Hi, @Dlagol
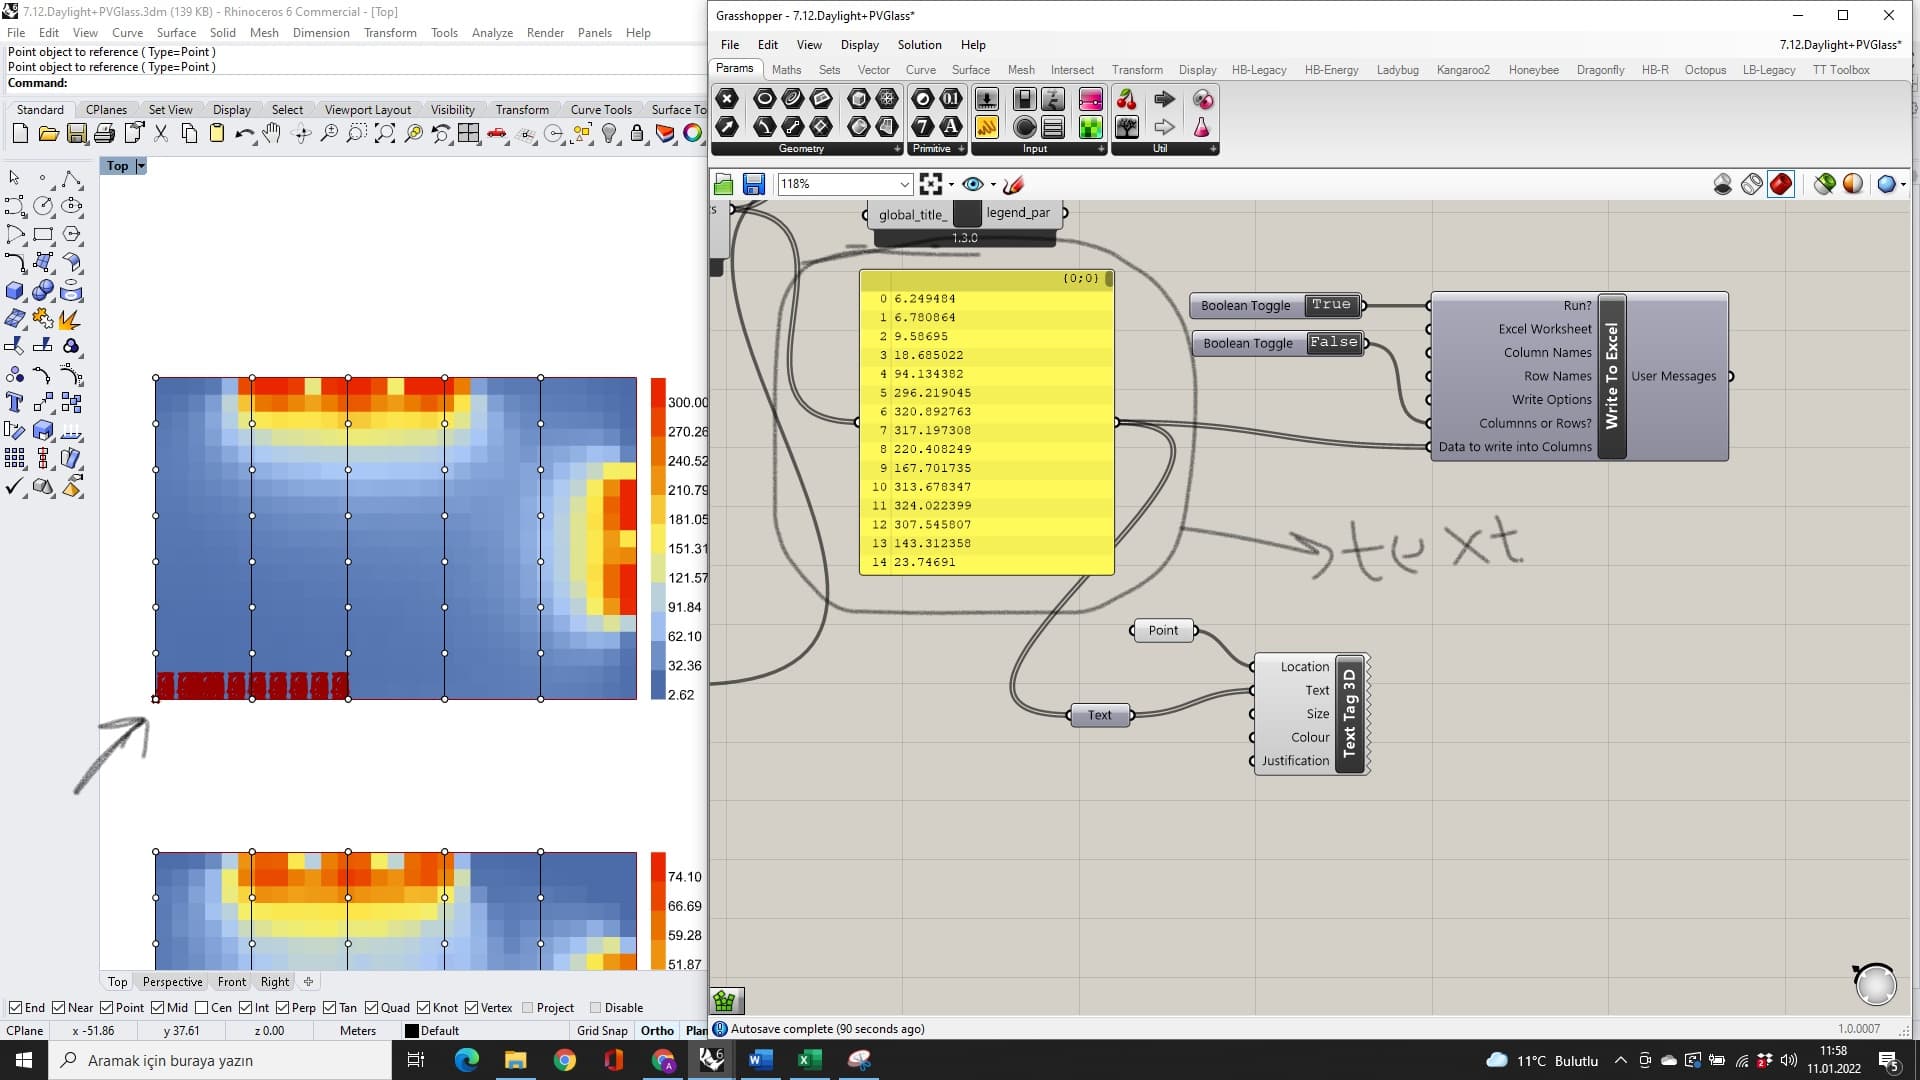
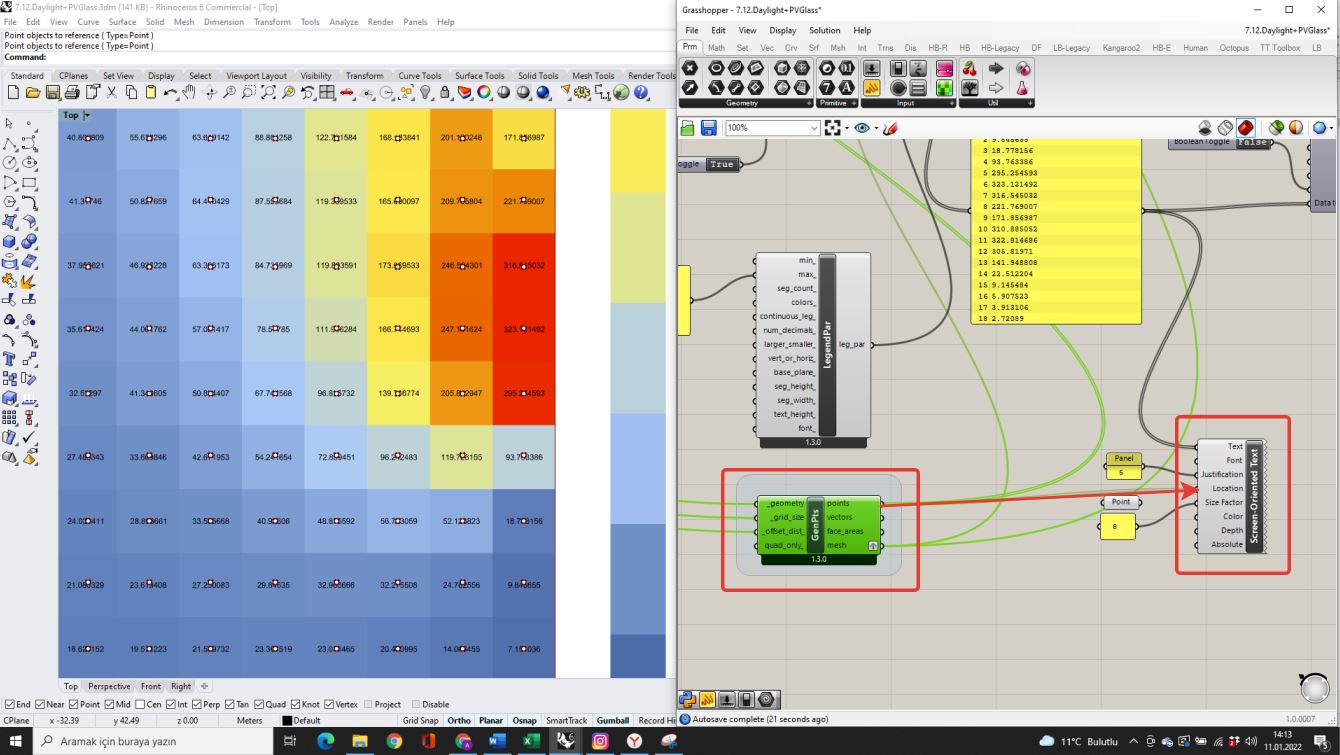
Yes, it is my bad. Now, I’ve correctly installed but I have another problem. The selection arrow is not correct. The red one is its selection and the blue track should be the proper one. I assume that it can be changable but I couldn’t find a way of it.
Sorry, I understood the mistake. I have had created individual points instead of using the points already existed on the sensor grid! Thank you very much again for your help, it finally worked properly.
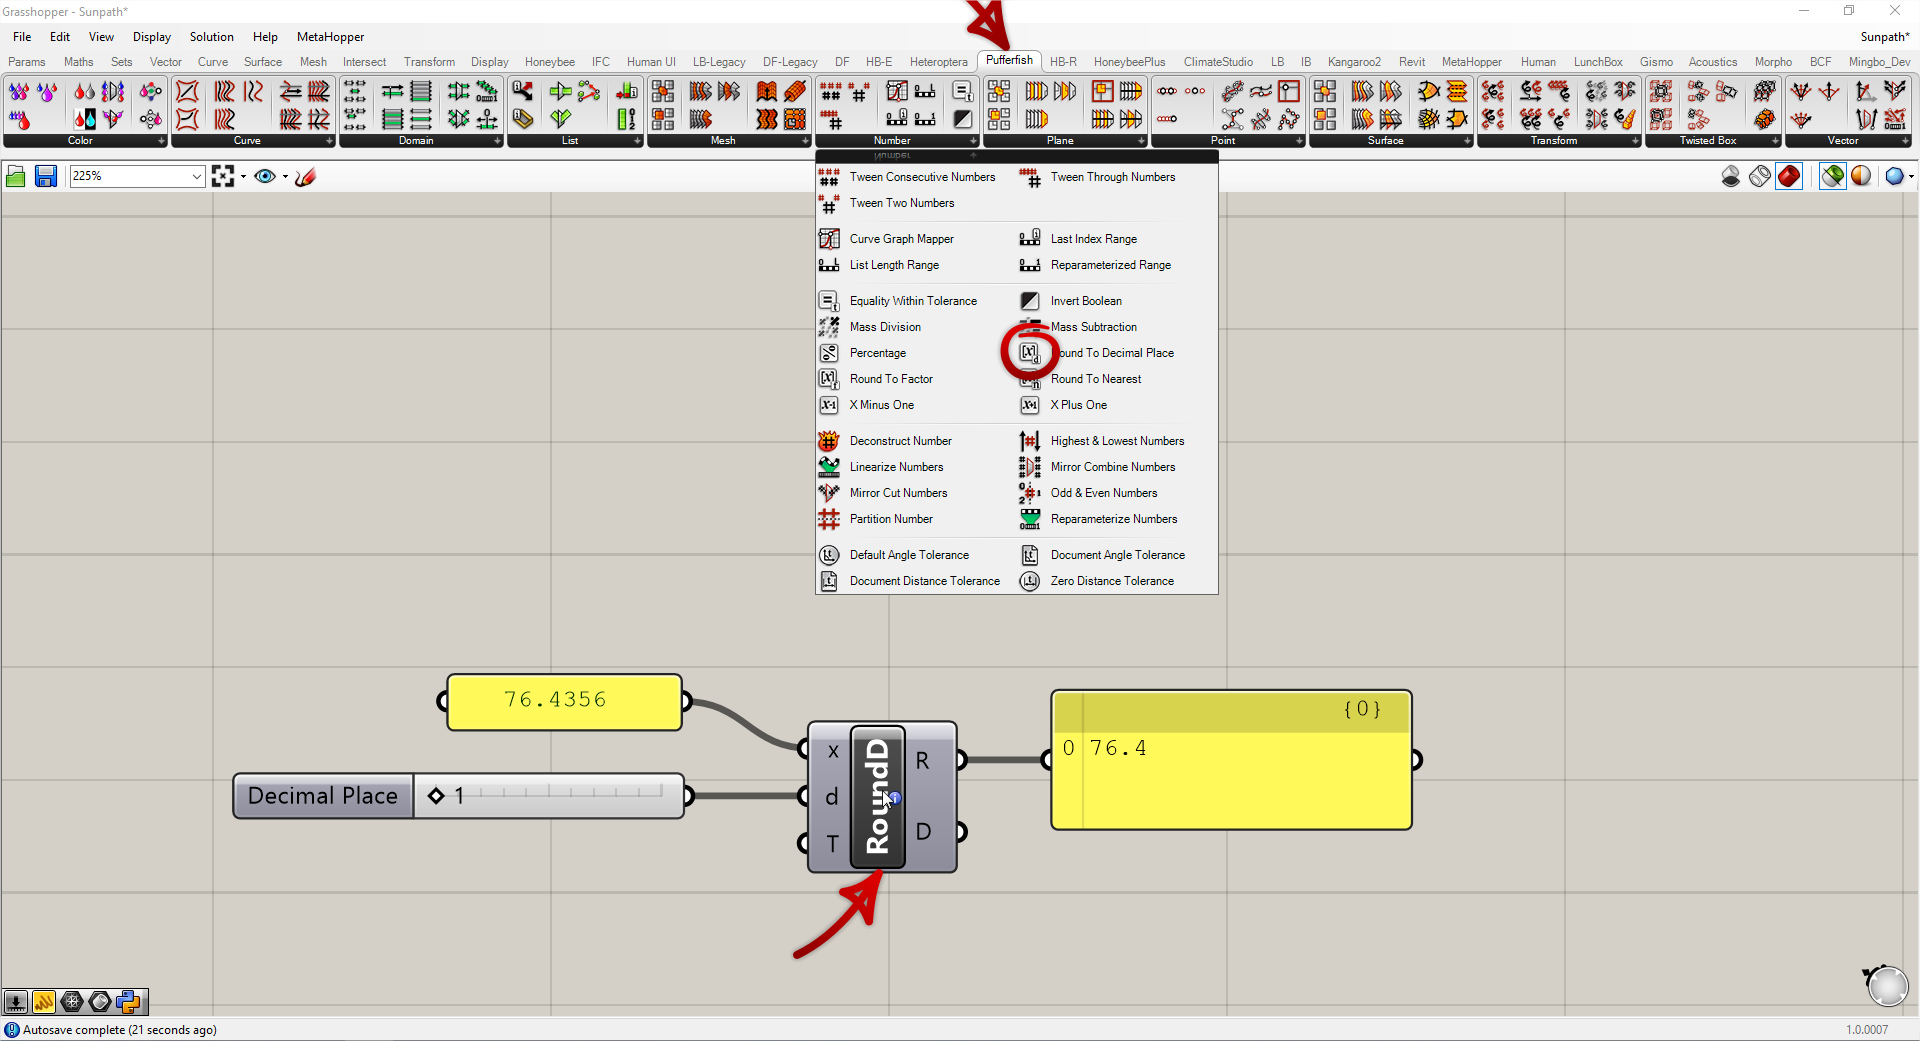
I have only one problem left. @Dlagol@Asisnath Do you have any idea how can I change decimals? For example, if the value is 145.9327263 then I only need 145, so that I can make the text bigger.
You just need to round up the numbers. I prefer using “Round to Decimal Place” from Pufferfish, since it gives you more control. See the attached screenshot…
The file has been changed throughout the time but I will try to find earlier versions. I will send if I can find it. But you can also read the comments, they helped me a lot!
hello!sorry to interrupt,i have the same problem with your case,i dont know how to create individual points of the sensor gird,i have known how to use “HB sensor grid from rooms”but i don‘t know how to locate the points and turn into the mesh,could you please help me?thank you so much!