Post processing Annual Irradiance in Python using grids

Hi LBT community,

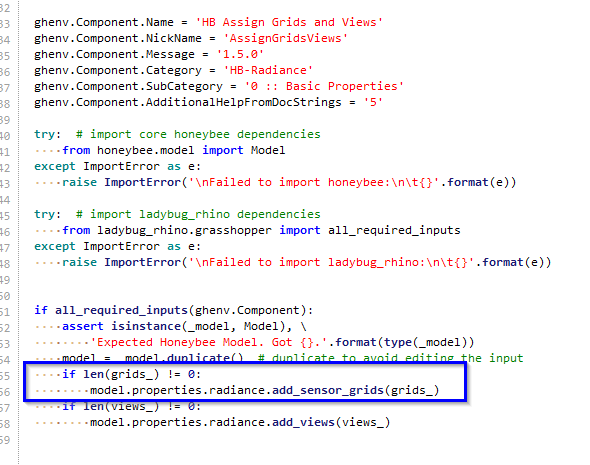
I’m doing some facade radiation analysis using HB Annual Irradiance to run a series of facade options. Along the lines of this:

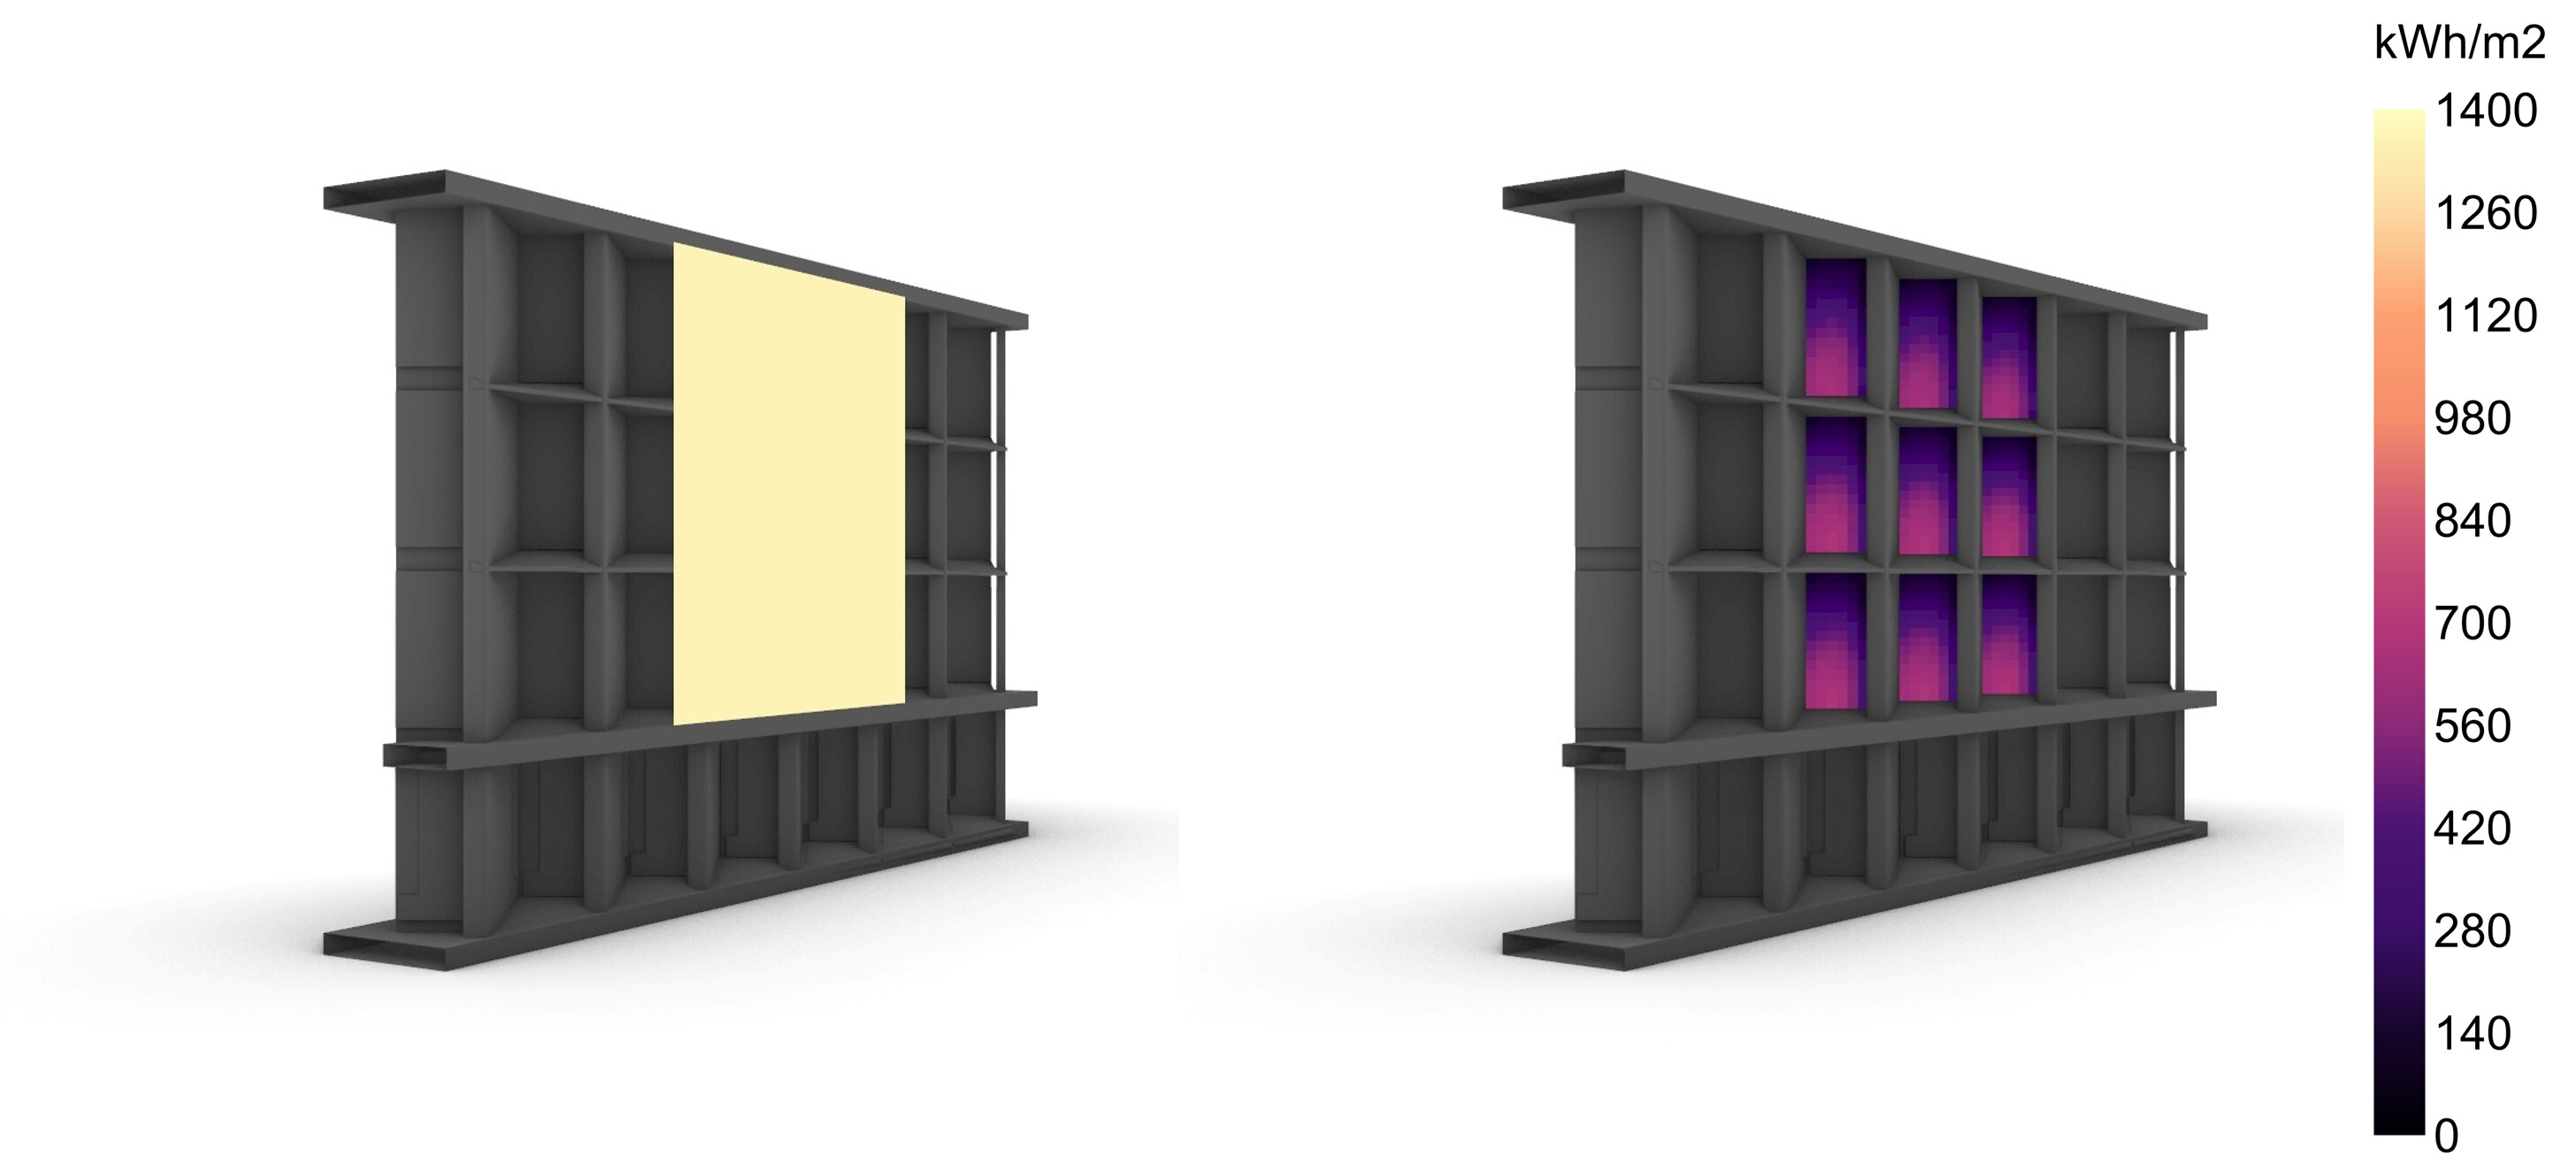
Each option has a large amount of variation, so I’ve chosen to run a typical floor from each to give some nice graphics, and also to capture all of the nuance in terms of geometry variation. Each option could have up to 10,000 sensors using a 0.2m grid size.

I’m using LB Fly (which seems to have been removed recently from Pollination Grasshopper plugin?) to run each option. I’ve also split each option into four primary facade directions and set them each to their own grid.

What I’m finding challenging is how to post process all the data.

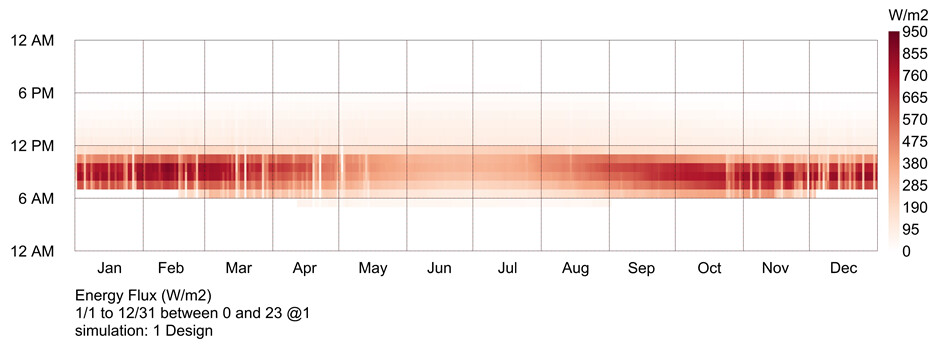
I was thinking of using Python to load up the simulation results, and post process them with their respective face areas to then give a weighted average hourly result in W/m2 for each facade orientation, to then plot on an Hourly Plot like this (per grid, per option, 4 grids, 14 options).

Does anyone have recommendations for how to bring across face areas and grid information into python to then convert my W/m2 ill results into W results, sorted for each grid?

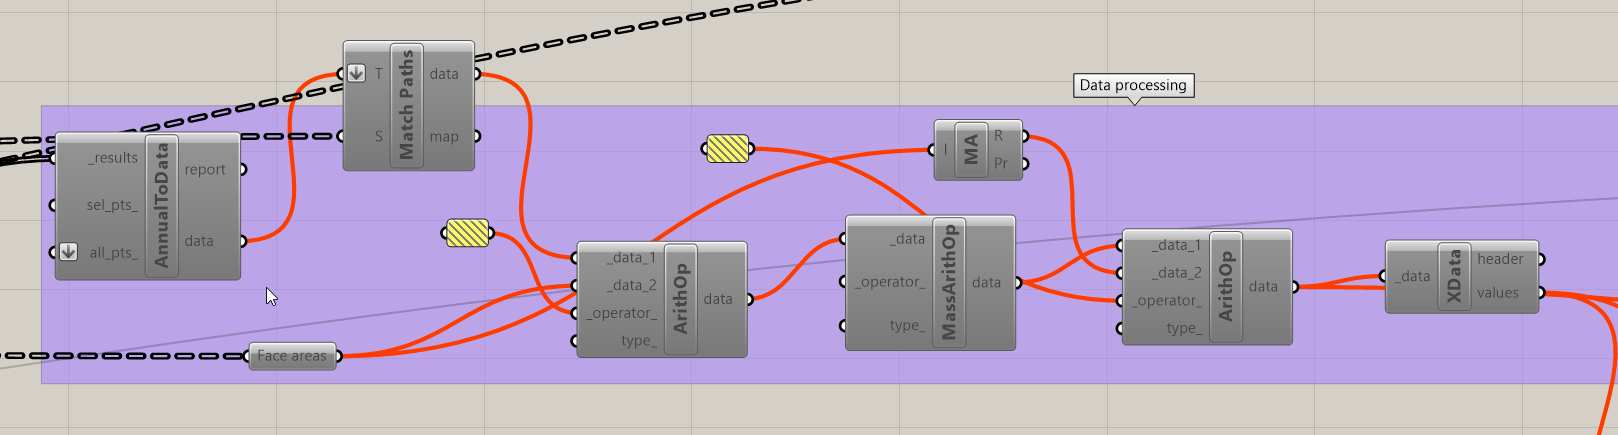
Post processing in GH seems to take a very long time (potentially because I’m also maxing out my memory), even using the great new tools that have been added for mathematical operations - but maybe I’m just going about it the wrong way.

Here’s a snap of the post processing in GH (match paths is being used to put the results into their grid data trees).

Any thoughts how to do this process better, particularly on how to work with grids and face areas in python, would be really appreciated.

Thanks,
Charlie

Hi @charlie.brooker ,
Not sure about what i’m writing, but …
I’m pretty sure that from the LBT SDK you can draw each face area (i mean each grid face). If so, you can multiply that by the EnergyFlux and get the W per grid.
Makes sense? Or i misunderstood your question?
-A.

Thanks @AbrahamYezioro - I think you’ve understood the question! :slight_smile:

(I didn’t do a great job of explaining it!)

I was struggling to find the methods in the LBT SDK to get grid and face area information, I definitely could’ve missed something though.

I get what you are saying. I can’t find the grid module in the SDK documentation.
I’m sure @chris can provide very good pointers.
This is an interesting topic for many reasons.
-A.

I hope this helps!

I do most of my post-processing work in a Jupyter notebook and have found it useful to load in the .hbjson for the model at hand. You can read it into a dictionary very quickly and then convert that into an object that represents the model (although I prefer the dictionary). From that you can find a bunch of details in the radiance section. You can also load up the .ill results file very quickly into a pandas dataframe. Just note that the .ill file is sunlight hours only so you will need to fill in the blanks.

Assuming you name all of the irradiance grids distinctly, you should be able grab them from the model_dict very easily.

Function to load the hbjson into a dictionary and then convert to the model

import json 
from honeybee.model import Model

def load_model(fp):
    with open(fp) as f:
        model_dict = json.load(f)
    model = Model.from_dict(model_dict)
    return model

A simple function to read an .ill file.

import pandas as pd

def read_ill(fp):
    with open(fp) as f:
        ill = pd.read_csv(f, delimiter=' ', header=None).iloc[:, 1:].T.reset_index(drop=True)
    return ill

These should help you parse and .ill file and sun-up-hours.txt file into a data frame.

import pandas as pd

def create_sun_mask(sun_hours_fp):
    with open(sun_hours_fp) as f:
        sun = pd.read_csv(f,names=['HOY']) 
    sun_hours = np.floor(sun).astype(int)
    empty = pd.DataFrame(data={'HOY':list(range(0,8760))})
    def eval_sun_up(HOY,sun_up_list):
        if HOY in sun_up_list:
            return True
        else:
            return False
    sun_up = empty.apply(lambda x: eval_sun_up(x['HOY'],sun_hours['HOY'].tolist()),axis=1)
    sun_up = pd.DataFrame(sun_up).reset_index().rename(columns={"index":"HOY",0:"Sunny"})
    return sun_up, sun_hours

def eval_ill_year(sun_hours_fp, ill_fp):
    sun_up, sun_hours = create_sun_mask(sun_hours_fp)
    with open(ill_fp) as f:
         ill = pd.read_csv(f, delimiter=' ', header=None).iloc[:, 1:].T.reset_index(drop=True)
    sun_ill = pd.concat([sun_hours,ill],axis=1)
    return pd.merge(sun_up,sun_ill,how="left",on="HOY").fillna(0)
4 Likes

Thanks for the reply @justinfmccarty!

image

Your response put me on the right path. Looking at the code in the HB Assign Grids and Views component (above) I spotted that the grid is added under

model.properties.radiance

which when I use in Jupyter shows me the associated instances and functions, using your model function above to create mymodel (excuse my poor Python!). That gave me access to the sensor grid, which I think will then give me the data I need to do the grid based processing I was hoping to do using the properties listed here honeybee_radiance.sensorgrid module — honeybee radiance documentation

mymodel.properties.radiance.sensor_grids[0].sensors

@justinfmccarty I had a cheeky look at your LinkedIn, are you using LBT in Python to evaluate BIPV?

I still can’t figure out a good approach for accessing face areas. Given that LBTs meshing often results in quite a large amount of variation in face areas, and often a high distribution of sensors at the edges of geometry, I would be much happier using face areas to get a weighted average radiation for a grid rather than just taking an average.

@chris would it be possible to add face areas as an optional input for a sensor grid?

Edit
Apologies Chris, I jumped the gun there, the SensorGrid.mesh.face_areas appears to contain that data :smiley:

1 Like

@charlie.brooker I am indeed! Glad to be connected with you. I run irradiance sims with honeybee to get cell level irradiance. Because the cels in my work are all the same size I don’t rely on the face area parameter, I just bury the cell width and height in the sensor grid name. Something like <hbgrid_200x_200y>. Then I parse those out as millimetres later on.

My research needs cell level because I do a lot related to non uniform shading and electrical architectures for facade systems. So once I have the irradiance map I move away from grasshopper and ladybug for numpy for speed.

1 Like

Hey @charlie.brooker . I just wanted to say sorry for the late response here and I am glad that you figured it out. SensorGrid.mesh.face_areas is the right way to do it.

And very cool advanced stuff you’re doing there @justinfmccarty !

1 Like