Hello Everyone!!
am trying to run thermal comfort indices indoor for predicted heat strain.
I have this error while everything else seem right
any idea why this is happening?
Hello Everyone!!
am trying to run thermal comfort indices indoor for predicted heat strain.
I have this error while everything else seem right
any idea why this is happening?
Hi @NorhanBayomi. I see the screenshot of your problem. It is diffcult to debug. So please upload your grasshooper file for further discussion.
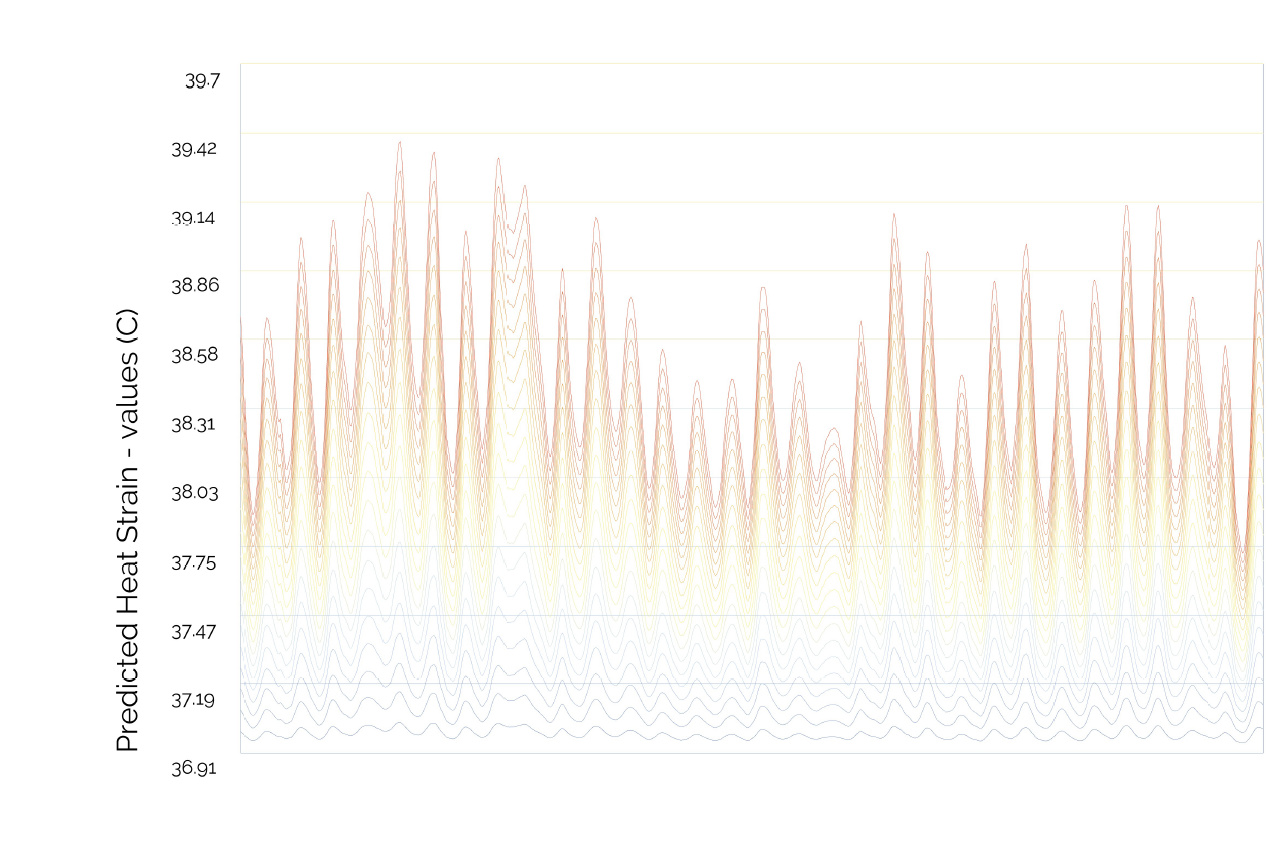
Problem Solved but having now a different problem with the visualization of the results
Am looking at Predicted Heat Strain and the values exported doesn’t have these higher values in Excel but it show up like this in GH
X-Axis is each hour in july
Y-Axis is the predicted heat strain from the simulation
am doing this for indoor condition in a house of 20 spaces.
Excel values doesn’t exceed 37.099 but the visualization is totally different.
Any Idea?
Hi @NorhanBayomi,
I agree with what Yin said: it is always useful to upload the .gh file.
I didn’t understand what is the issue right now?
You have some Predicted Heat Strain values in an Excel sheet. Where do they come from?
And you are comparing them with the values from the “Thermal Comfort Indices” component, and these are much higher?
Hi @djordje am trying to run a thermal comfort indices calculations for indoor conditions. The case i have is a three story building with 20 spaces. The output of predicted heat strain (20 curve) when connected to a 3D chart in GH, the view doesn’t match the actual results (exported to excel).
Also, I know that this component was developed from outdoor conditions mainly, how reliable it is for indoor simulation as am interested in measuring potential heat stress in case of increased indoor temperature.
thanks!!
Hi @NorhanBayomi,
You create a list of Predicted Heat Strain values from the “Thermal Comfort” component. Then you copied those values from the “Thermal Comfort” “PHS” output to Excel sheet and created a 2d chart.
This Excel 2d chart does not match the 3d chart created with Ladybug’s “3D Chart” component?
Did I understand that correctly? Then the issue might be somehow with “3D Chart” component.
PHS index is used for both indoor and outdoor conditions.
Yes this is correct.
I believe that might be the problem then.
Thanks alot for your help.
@NorhanBayomi are you allowed to attach your .gh file? If not, I would understand.
Make sure to use the “Body Characteristics” component as well, as an input for the “bodyCharacteristics_”.
This is because PHS index can vary depending on all parameters used in “Body Characteristics” component except clothingAlbedo_ and sex_.
Methodology for PHS index calculation is described in the following paper:
http://www.deparisnet.be/chaleur/Normes/Malchaire_PHS_Predicted_Heat_Strain_standard%207933_22-7-13.pdf
Let us know if you have any other issues.
@djordje any luck looking at the script? I was wondering what is the reference for Heart Rate calculations and Dehydration Risk. I am looking at what is the best determinant for potential health risks associated with increased overheating.
Hi @NorhanBayomi,
Sorry for the late reply. To be honest I opened your file and closed it. Too much geometry to calculate, and I don’t even have Honeybee installed. I need to buy a better PC, this one is really dragging me related to any work, not only opening other people’s Ladybug .gh files.
For the sources of the PHS and any other index from “Thermal comfort indices” component check this reply for old Ladybug forum.
As stated in that reply, if you double click on the Thermal comfort indices, you can look for the source code of each of the indices. In case of “HeartRate” index, the line 1177 shows the reference for the formula:
Pulse rate (HR) and acceptable level physical activity (MHR)
One of the most important physiological characteristics is the heart rate
(HR - Heart Rate). It determines the number of heartbeats per minute. On value140 Bioclimatic conditions for recreation and tourism in Poland
HR is affected by both physical activity and some parameters
meteorological (air temperature and water vapor pressure). information
with a possible heart rate is very useful in assessing working conditions
and active recreation and tourism. HR is the most often measured parameter
heart rate can also be estimated by the following formula (Fuller,
Brouha 1966):HR = 22.4 + 0.18 · M + 0.25 · (5 · t + 2.66 · vp) [7.14]
For the the dehydratation risk, check the line 1259 of the THI component source code.
The calculated SW values are essentially a water loss of the body in g/hour.
Once again, sorry for not being able to help you directly with your .gh file.