Hi LBT community,
Inspired by the Pollination workshop @chris gave at Shape to Fabrication I wanted to share a script I put together to process Daylight Factor results in Python.
The aim was to produce a script set that I could reuse for producing DF graphics to go into reports, with the main input being the DF recipe folder path to automate things as much as possible. I also included a grid_filter to make it easy iterate over different levels / room types.
Next steps would be to add labels per room to identify them as Bedroom / Living / Kitchen per BRE 209, along with median DF, a Pass/Fail, and the % of the room that meets the target median DF value. I’d also like to adapt it so it can be pointed at other recipe types, such as Annual Daylight, to quickly produce graphics for the CBDM metrics. If anyone take this code and adds these features please do share, at some point I’ll get more familiar with GitHub to make this easier.
Here’s an example of the output, another nice feature of the matplotlib export is this can be rasterized if saved as pdf/svg.
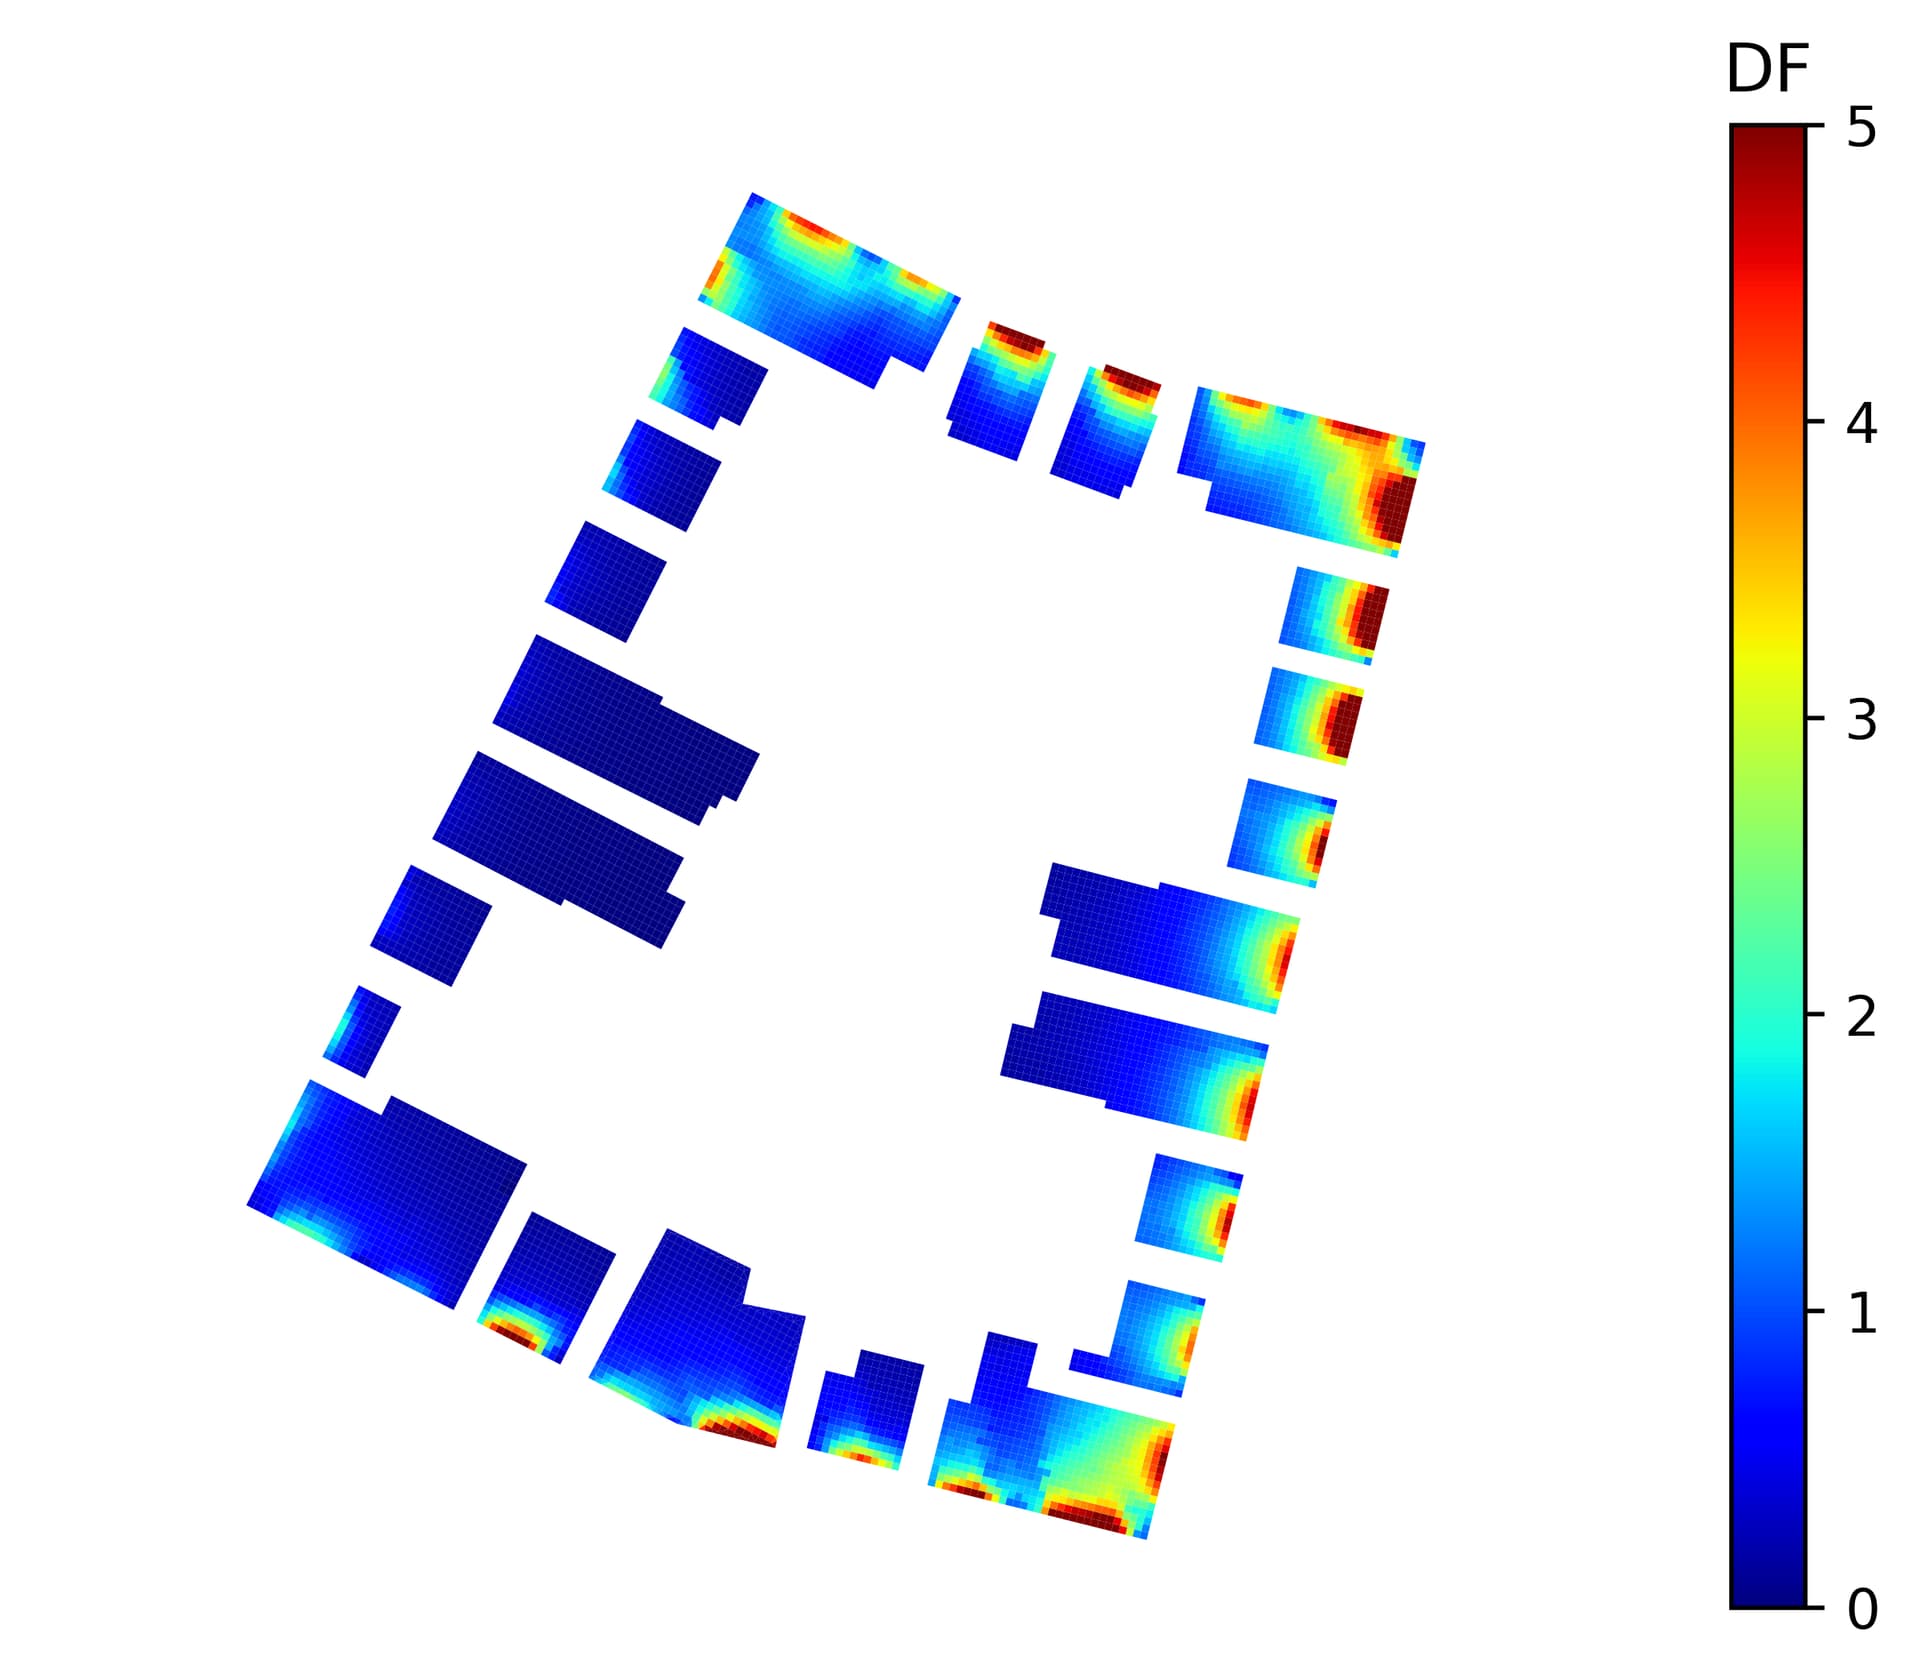
I’m still working on my Python formatting/style so apologies for the poorly documented code, and I’m sure I’ve gone about some of this very inefficiently. Essentially the code produces Matplotlib Patches for each mesh face to then assign a colour to.
Here’s the script as a Jupyter Notebook:
DF.ipynb (114.0 KB)