I’ve run a bunch of EP analyses with the re-runIDF component (idfs were generated with colibri iterator), and now I am trying to process the results. I’m using the “Honeybee Normalize Data by Floor Area” component, but I’m struggling with the data structure when using multiple result files. For a single result file, the “totNormData” output will look like this:
. What I’d like to get is essentially this output for each analysis in a branch of a tree.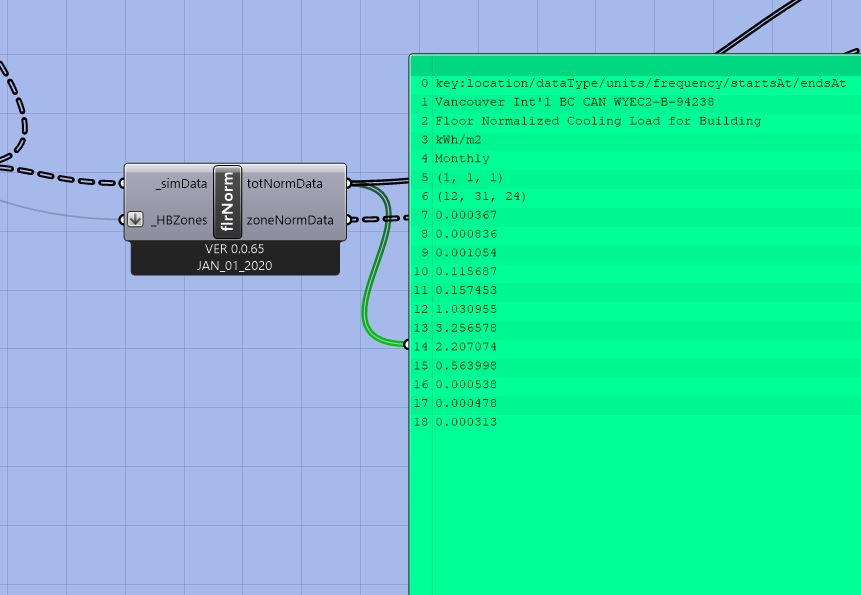
I’ve attached a simple example of this (requires colibri). In this example, there are 81 iterations, so I’d like final output to be a tree with 81 branches, each containing the totNormData for that iteration.
Thanks!
MultipleEP_Results.gh (565.8 KB)