Hi all,
I’m doing a parametric simulation of different facade variables, taking peak solar gain and daylight distribution for each iteration. One variable tested is the glass g-value (or SHGC), which I know has a relationship to the resultant visual transmittance of the glass. But I haven’t been able to find any formula to determine this and ensure the daylight results take this into account.
Does anyone have any suggestions?
Thanks,
James
Hi @jwoodall,
I’m not sure there would be such a formula that directly takes any SHGC and derives a VLT, as the relation of one to the other changes with different Low-E or other coatings (ie for the same SHGC there could be more than one VLT). However, a couple of resources could give you some hints:
-
The report behind the simple Window module in E+ explains how detailed glazing properties are derived from simplified glazing inputs in E+. Step 6 could be useful.
-
Window 7.7 and/or the International Glazing Database from Berkeley contain an extensive list of commercial glazing products, which could help you find some relationships.
It’s an interesting question to dig into, keep us posted if you find other leads.
To add to @RafaelA’s answer, you can also get this information from specific glass manufacturers. Since the performance of the low-e coating varies among glass manufacturers, I don’t think there’s a single formula that you can find to describe the relationship.
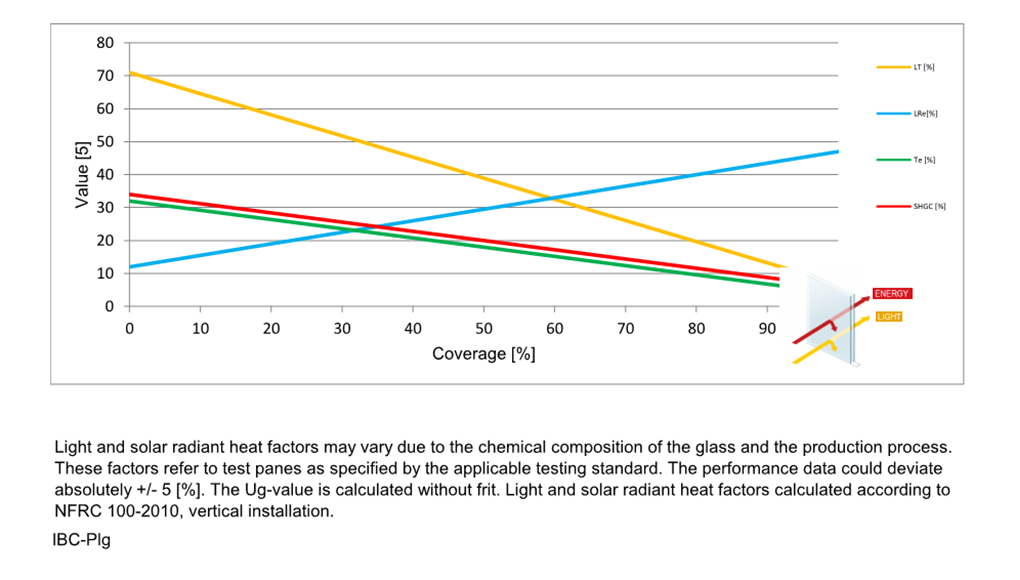
Here’s an example from Interpane (I think), which looks at LT, SHGC across different frit %:
As a rule of thumb, unless the SHGC is less then 0.3, you should be able to disregard the impact on LT, since most low-e coatings will maintain high LT (>0.7) for such cases. In my opinion, the only people who will even notice the difference between a 0.3, to 0.27 SHGC are extremely picky architects  .
.
@SaeranVasanthakumar the chart from Interpane is incredibly useful, do you remember where you found it exactly?
Thanks,
Andrea
@SaeranVasanthakumar I’d like to echo Andrea’s question and ask if you have a source for the graphic in your post above? I’ve Googled some phrases in the caption of the graphic but haven’t been able to find the exact source.
@andrea.botti - any chance you have found the source since you asked the question last year?
Thank you both!