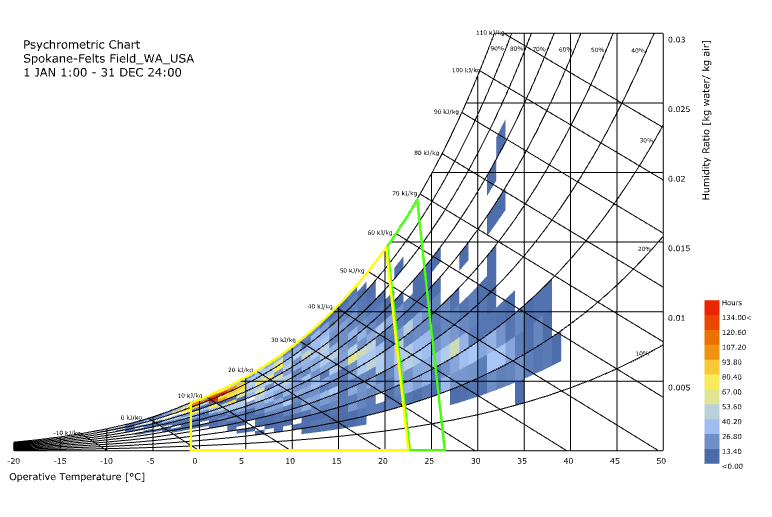
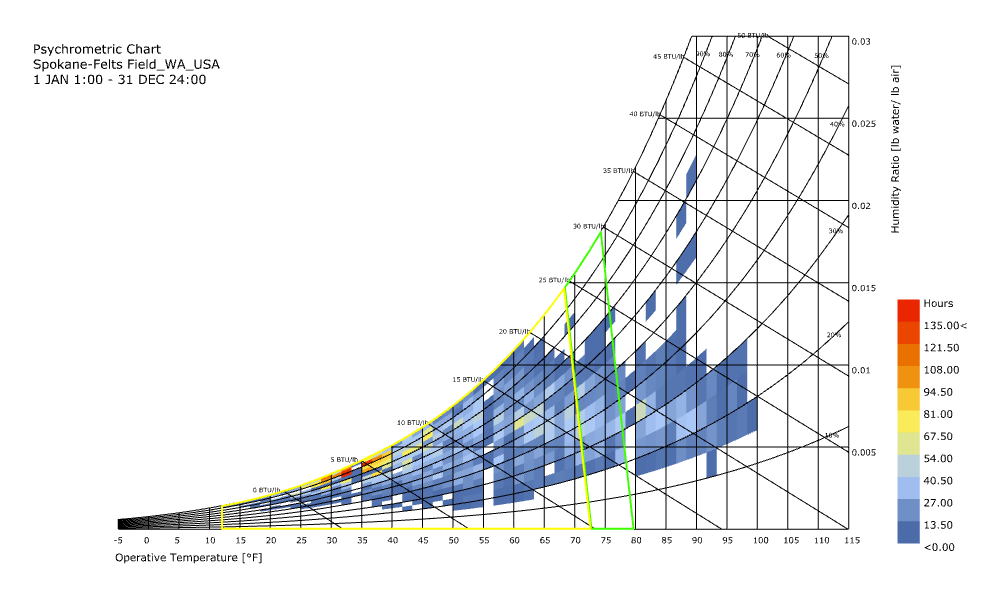
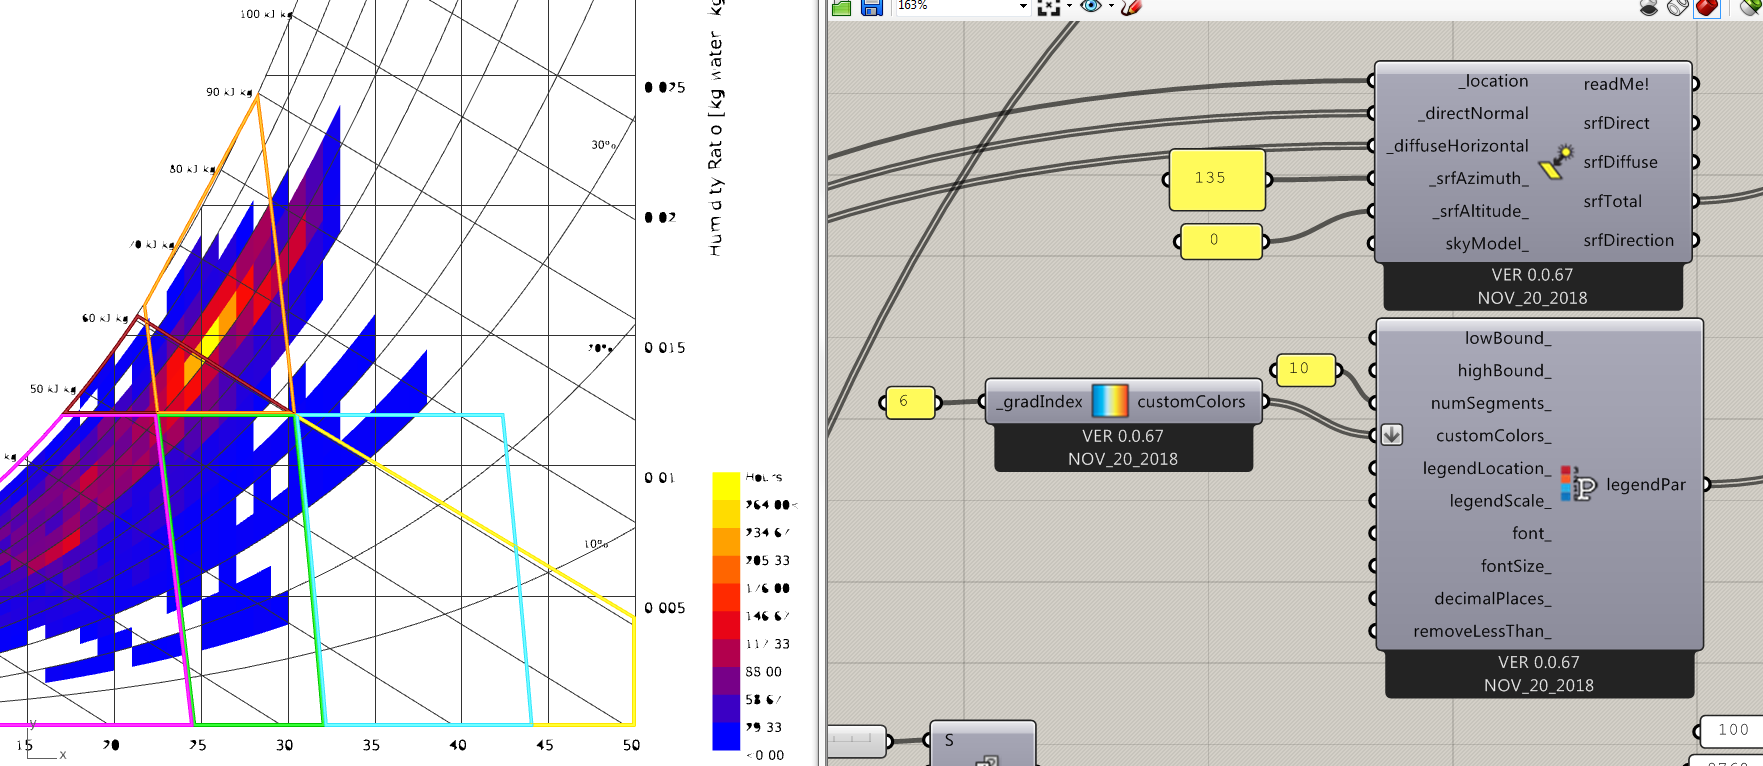
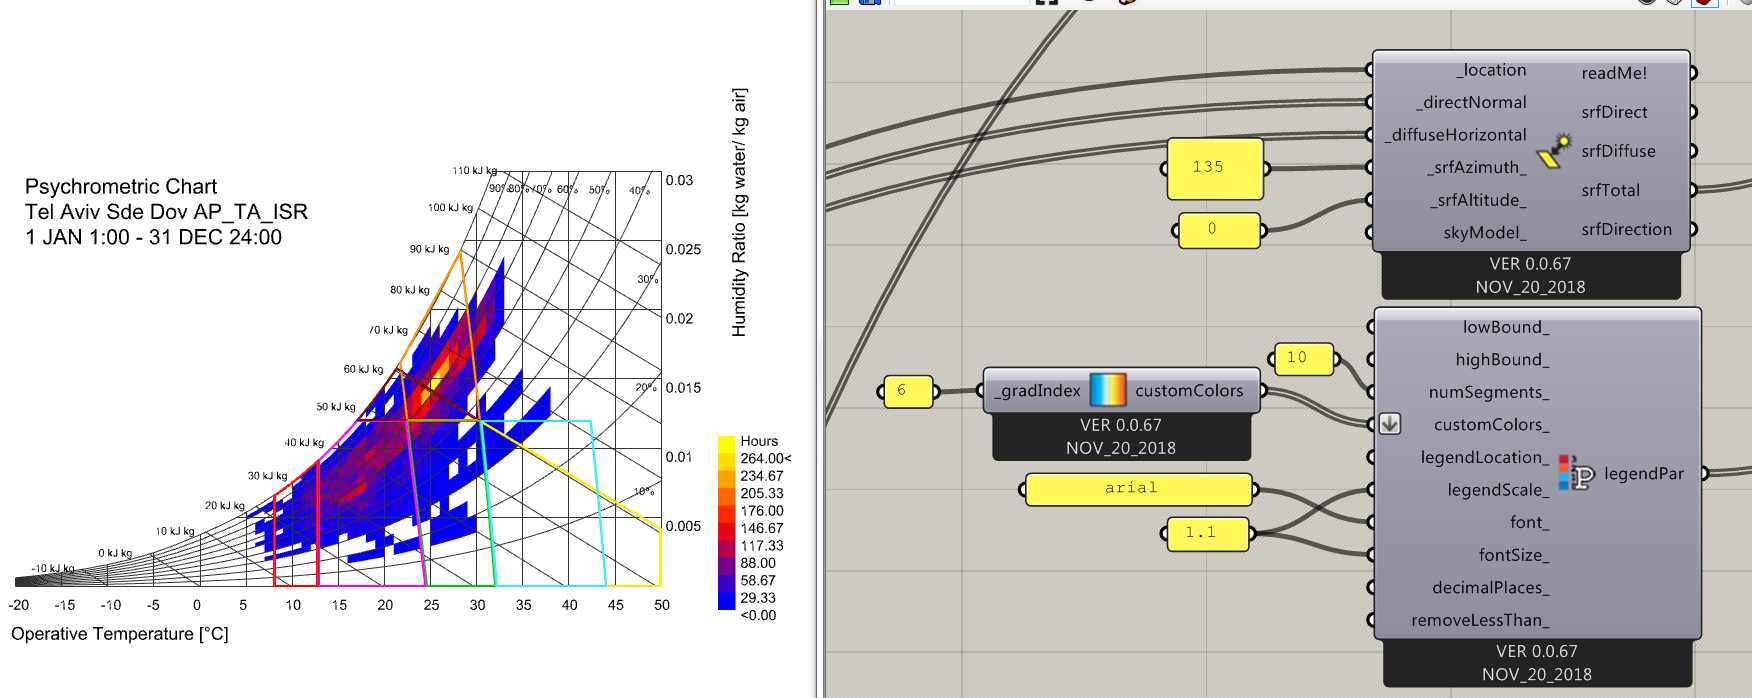
I am working in the US and I wanted to look into the potential benefits of passive solar for a project I am working on. I notice however a difference in the results when I switch the input units from Celsius to Farenheit. The strategy area created on the psychometric chart is larger when in Farenheit compared to Celsius, why is this happening?
Sorry for the late response. This smells like a bug with the passive solar polygon and I will look into it tomorrow. I added the passive solar polygon within the last year so it doesn’t surprise me that there may be a bug we overlooked. For now, I would trust the SI version of the polygon rather than the IP one.
Thank you for reporting this. It was indeed a bug in the unit conversions happening around the passive solar polygon. I have pushed the fix to the latest version on github:
Hi Chris,
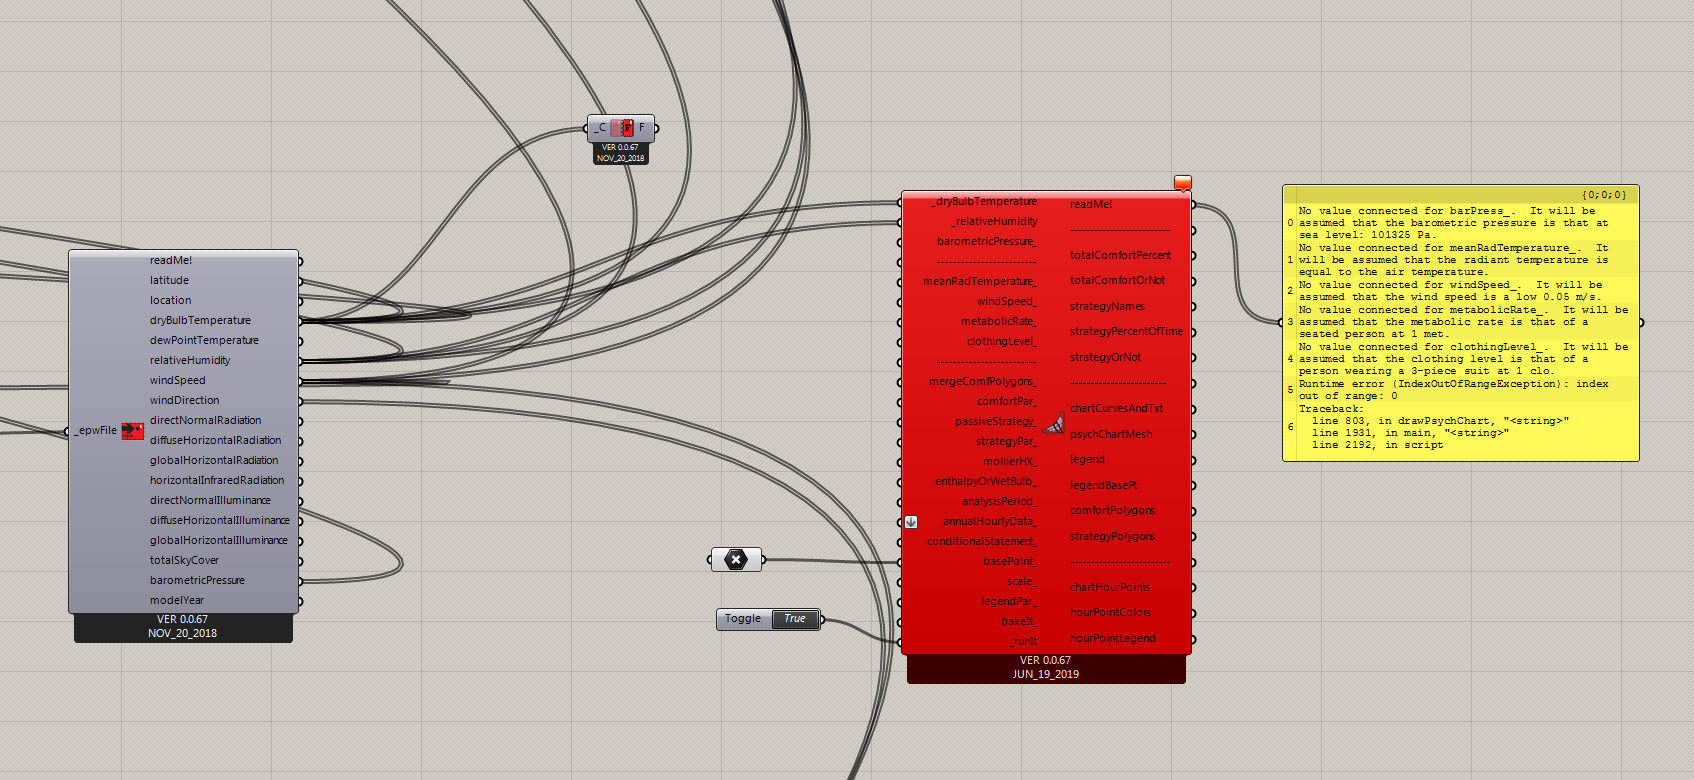
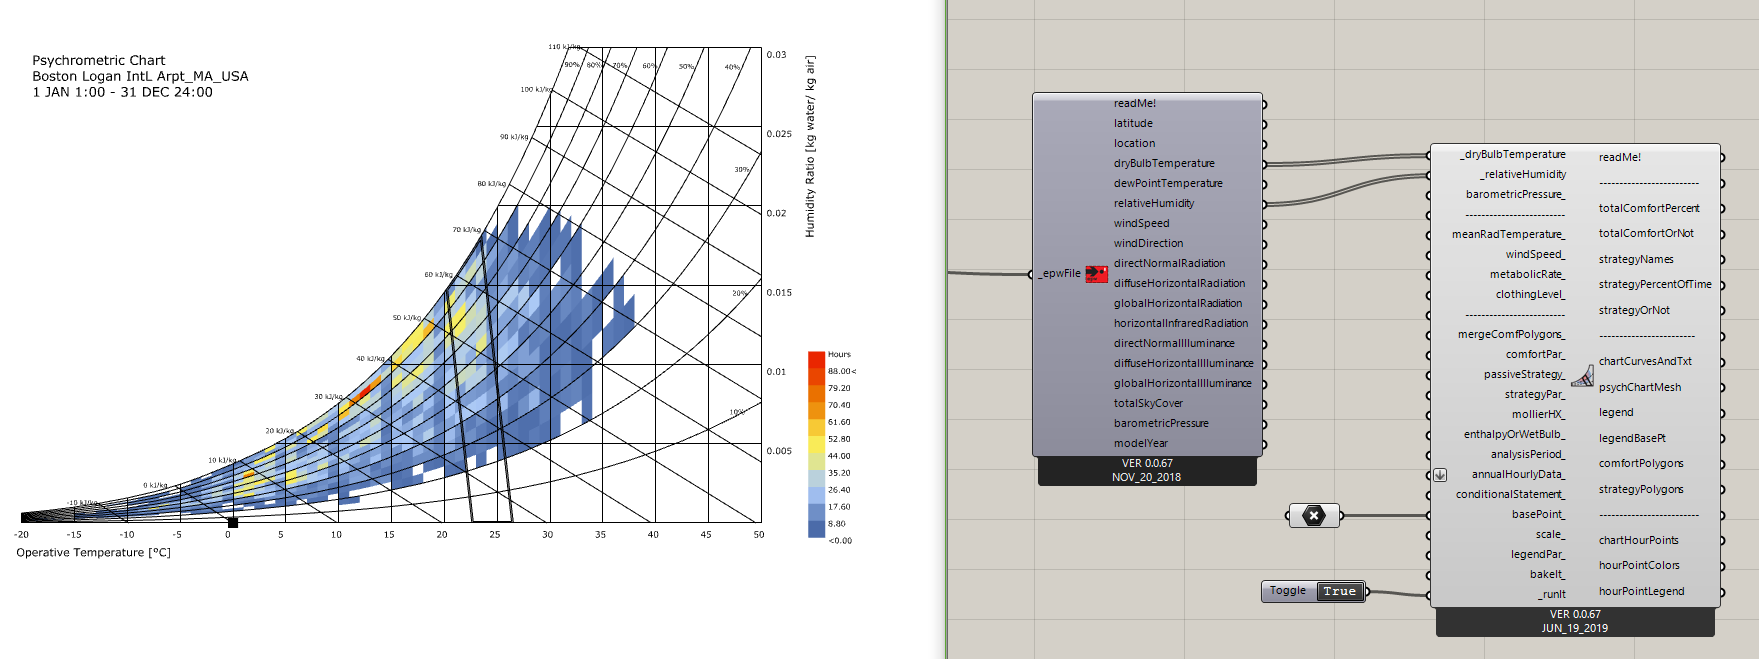
I have a related problem with the psychrometric chart tool in that it does not seem to work in metric at the moment. Just last week it was working. You will see below that if I connect the Ladybug C2F component than it works. I wonder how I can solve this as I need the units to be in metric?
I still cannot re-create your error, even in Rhino 5. I have to imagine that it is specific to your EPW data as well as Rhino 5. If you can upload your EPW or post the URL to the one you are using, I might be able to recreate it and fix it on my end.
@JulianaMoreira,
This is not related to the weather file. Is probably related to the units in Rhino and/or the tolerance there. It is been a while that this messy fonts appeared in this forum. You can search for this also.
-A.