Good afternoon,
This came up when I was working through the Ladybug_Psychrometric Chart component inputs to match climate consultants default inputs for ASHRAE 55. I can’t seem to get the same passive strategy results no matter what, but thats a different topic…
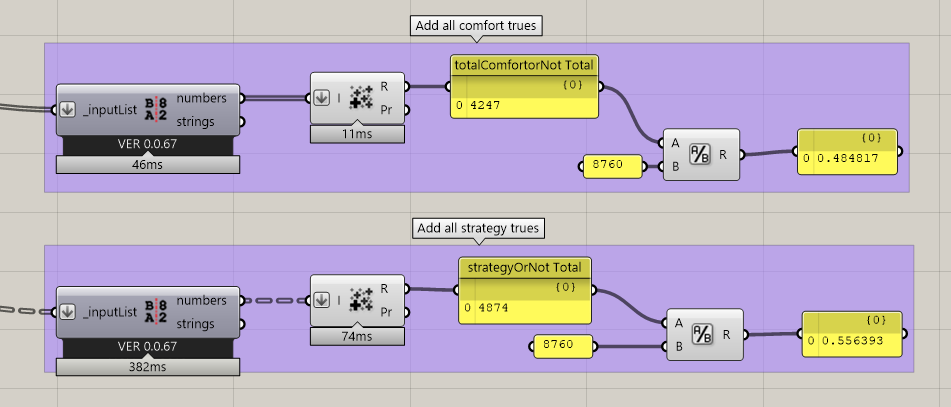
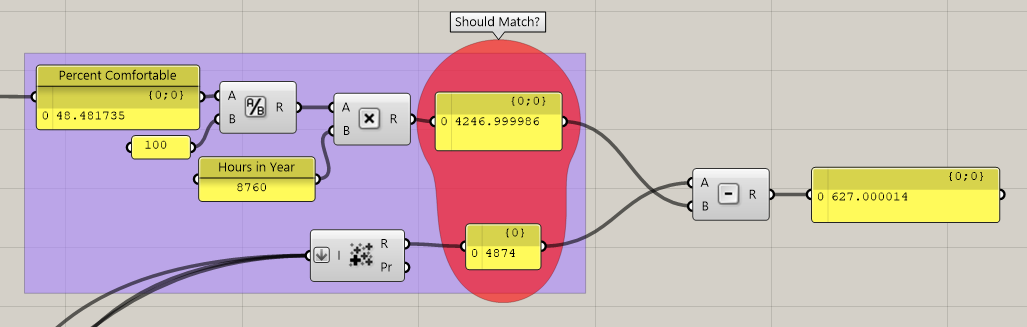
I noticed the totalComfortPercent is different from the value I get by adding up StrategyPercentofTime. I first assumed that the later (StrategyPercentofTime) would focus only on the strategies and come back lower by not include the value for comfort, but instead its actually coming back higher.
See photo and attached grasshopper definition. I tried to compare the two outputs in a few different ways, and whatever the discrepancy is, it seems to be consistent. Am I missing something? or should these values match? Perhaps the total comfort output is missing a strategy?
Thank you for any help you can offer, really appreciate it!
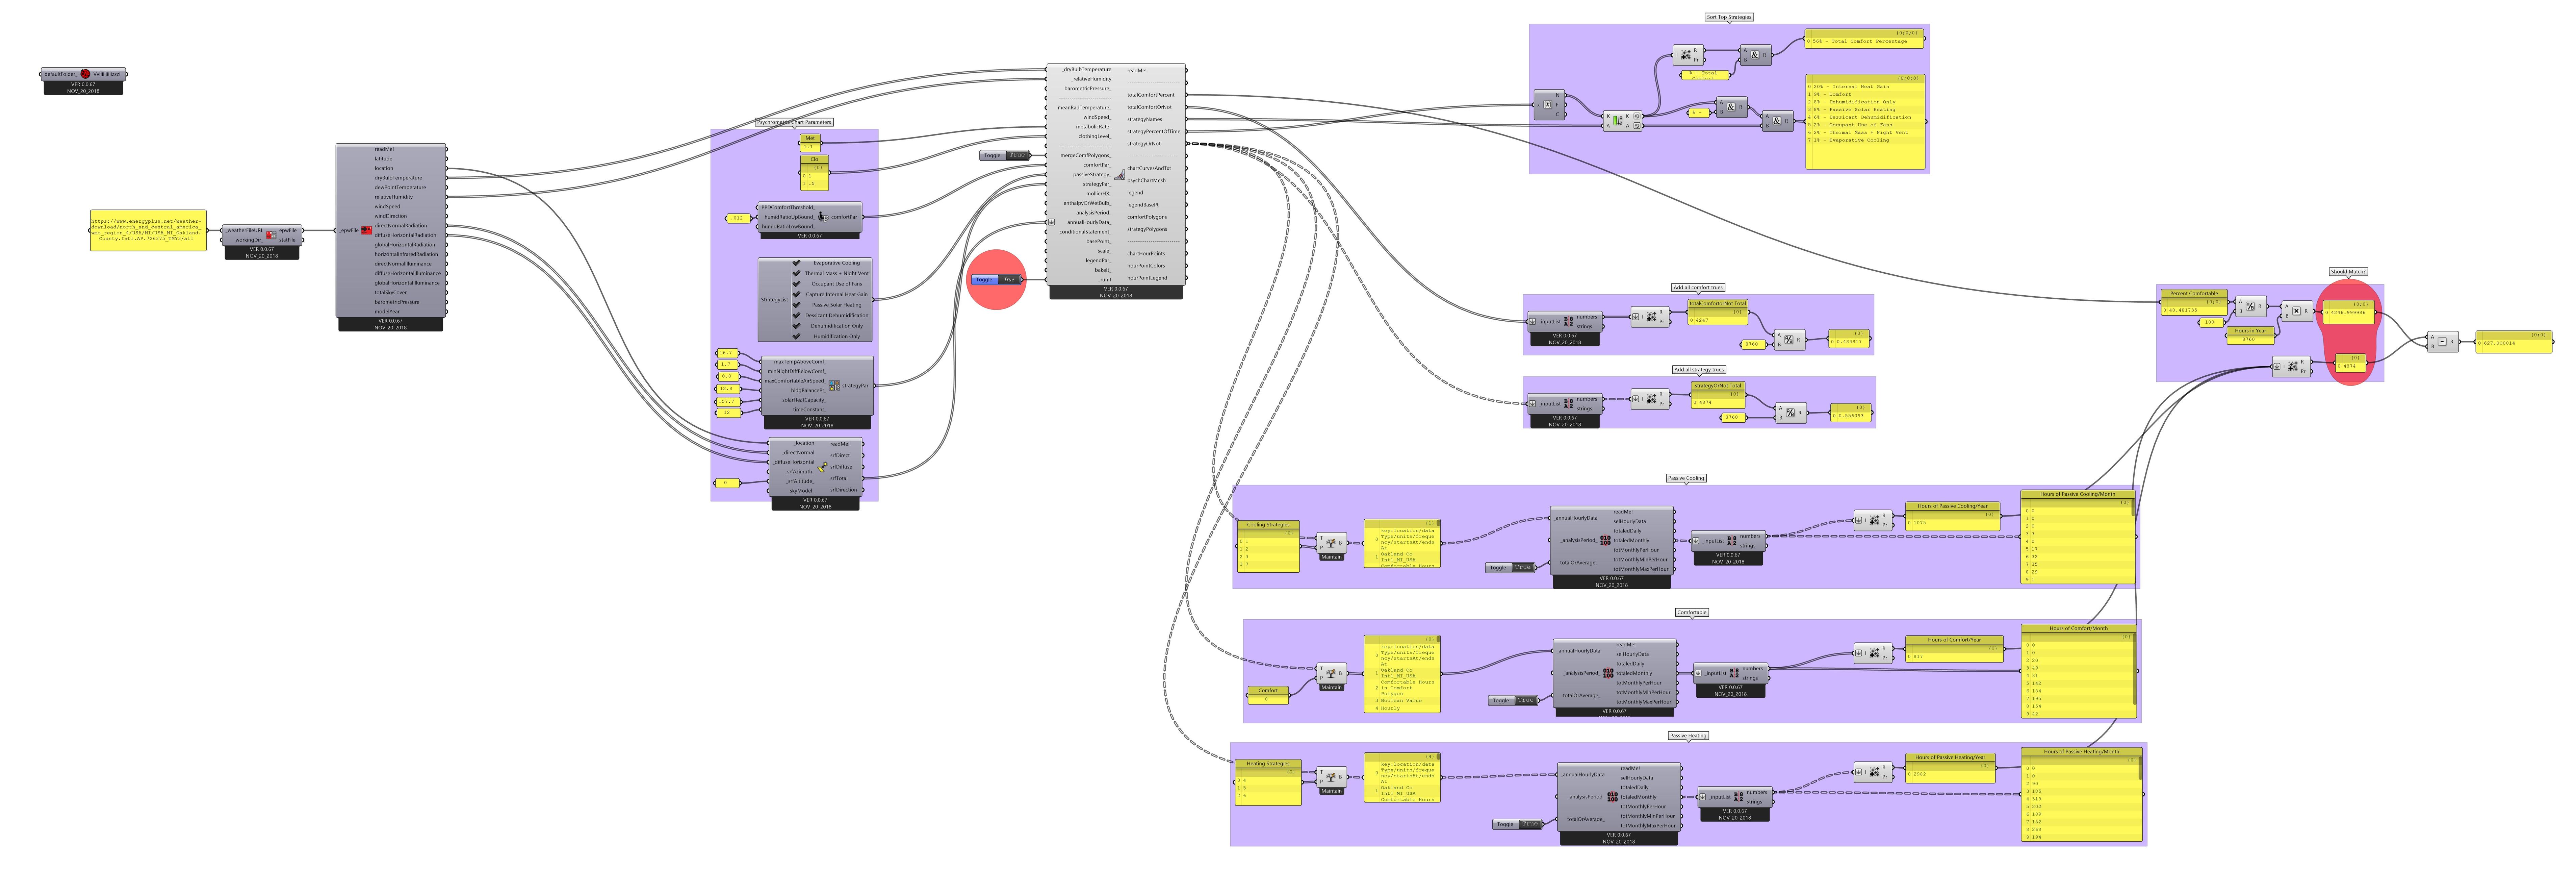
psychrometricchart_differing totals hours of comfort.gh (457.3 KB)
