Hey @AbrahamYezioro ,
No worries and good questions. Those static comfort polygons leave a lot of the PMV design space undescribed but here’s what I think the author of those graphics was thinking. Given that these polygons are supposed to be “between 1.0 and 1.3 met,” they decided to just depict them in the middle of this range, using a met of 1.15 for both polygons. When I do this, I get pretty good alignment with the graphic published in the standard:
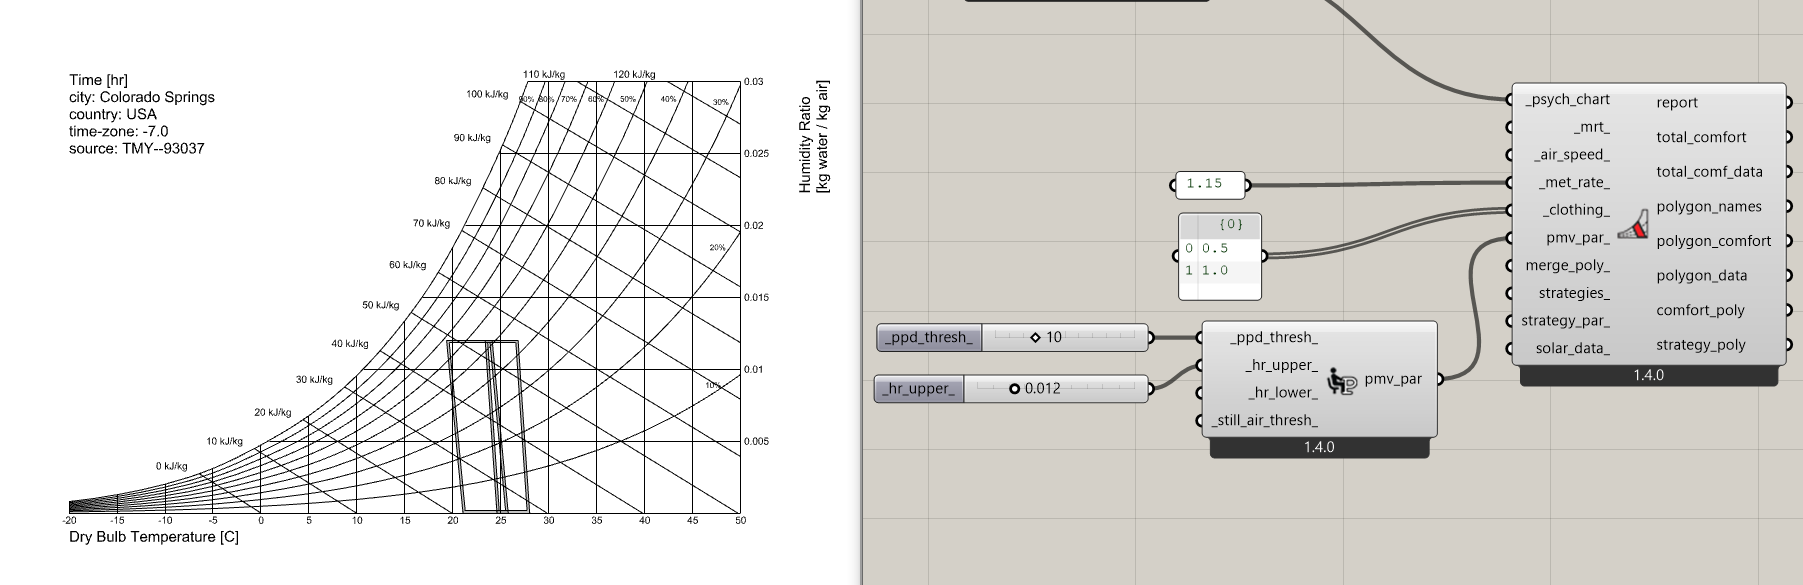
psychrometric_chart_ashrae55_graphic.gh (33.1 KB)
Depending on what version of ASHRAE-55 you took the graphics from, the air speed they assumed may also be slightly different. In the most recent version of the standard, they changed the “still air threshold” from 0.2 m/s to 0.1 m/s. Given that your graphic still says “0.2 m/s”, I would assume it’s from an older version of the standard and so they might have drawn those polygons using 0.2 instead of 0.1. But this should be a comparatively smaller difference than the met.
In any event the “modern” version of that graphic that the ASHRAE-55 committee members point everyone to these days is the CBE Tool here:
You should find very good agreement between the Ladybug psych chart and that interactive graphic, particularly because the ladybug code was derived from that tool’s javascript code.