Hi,
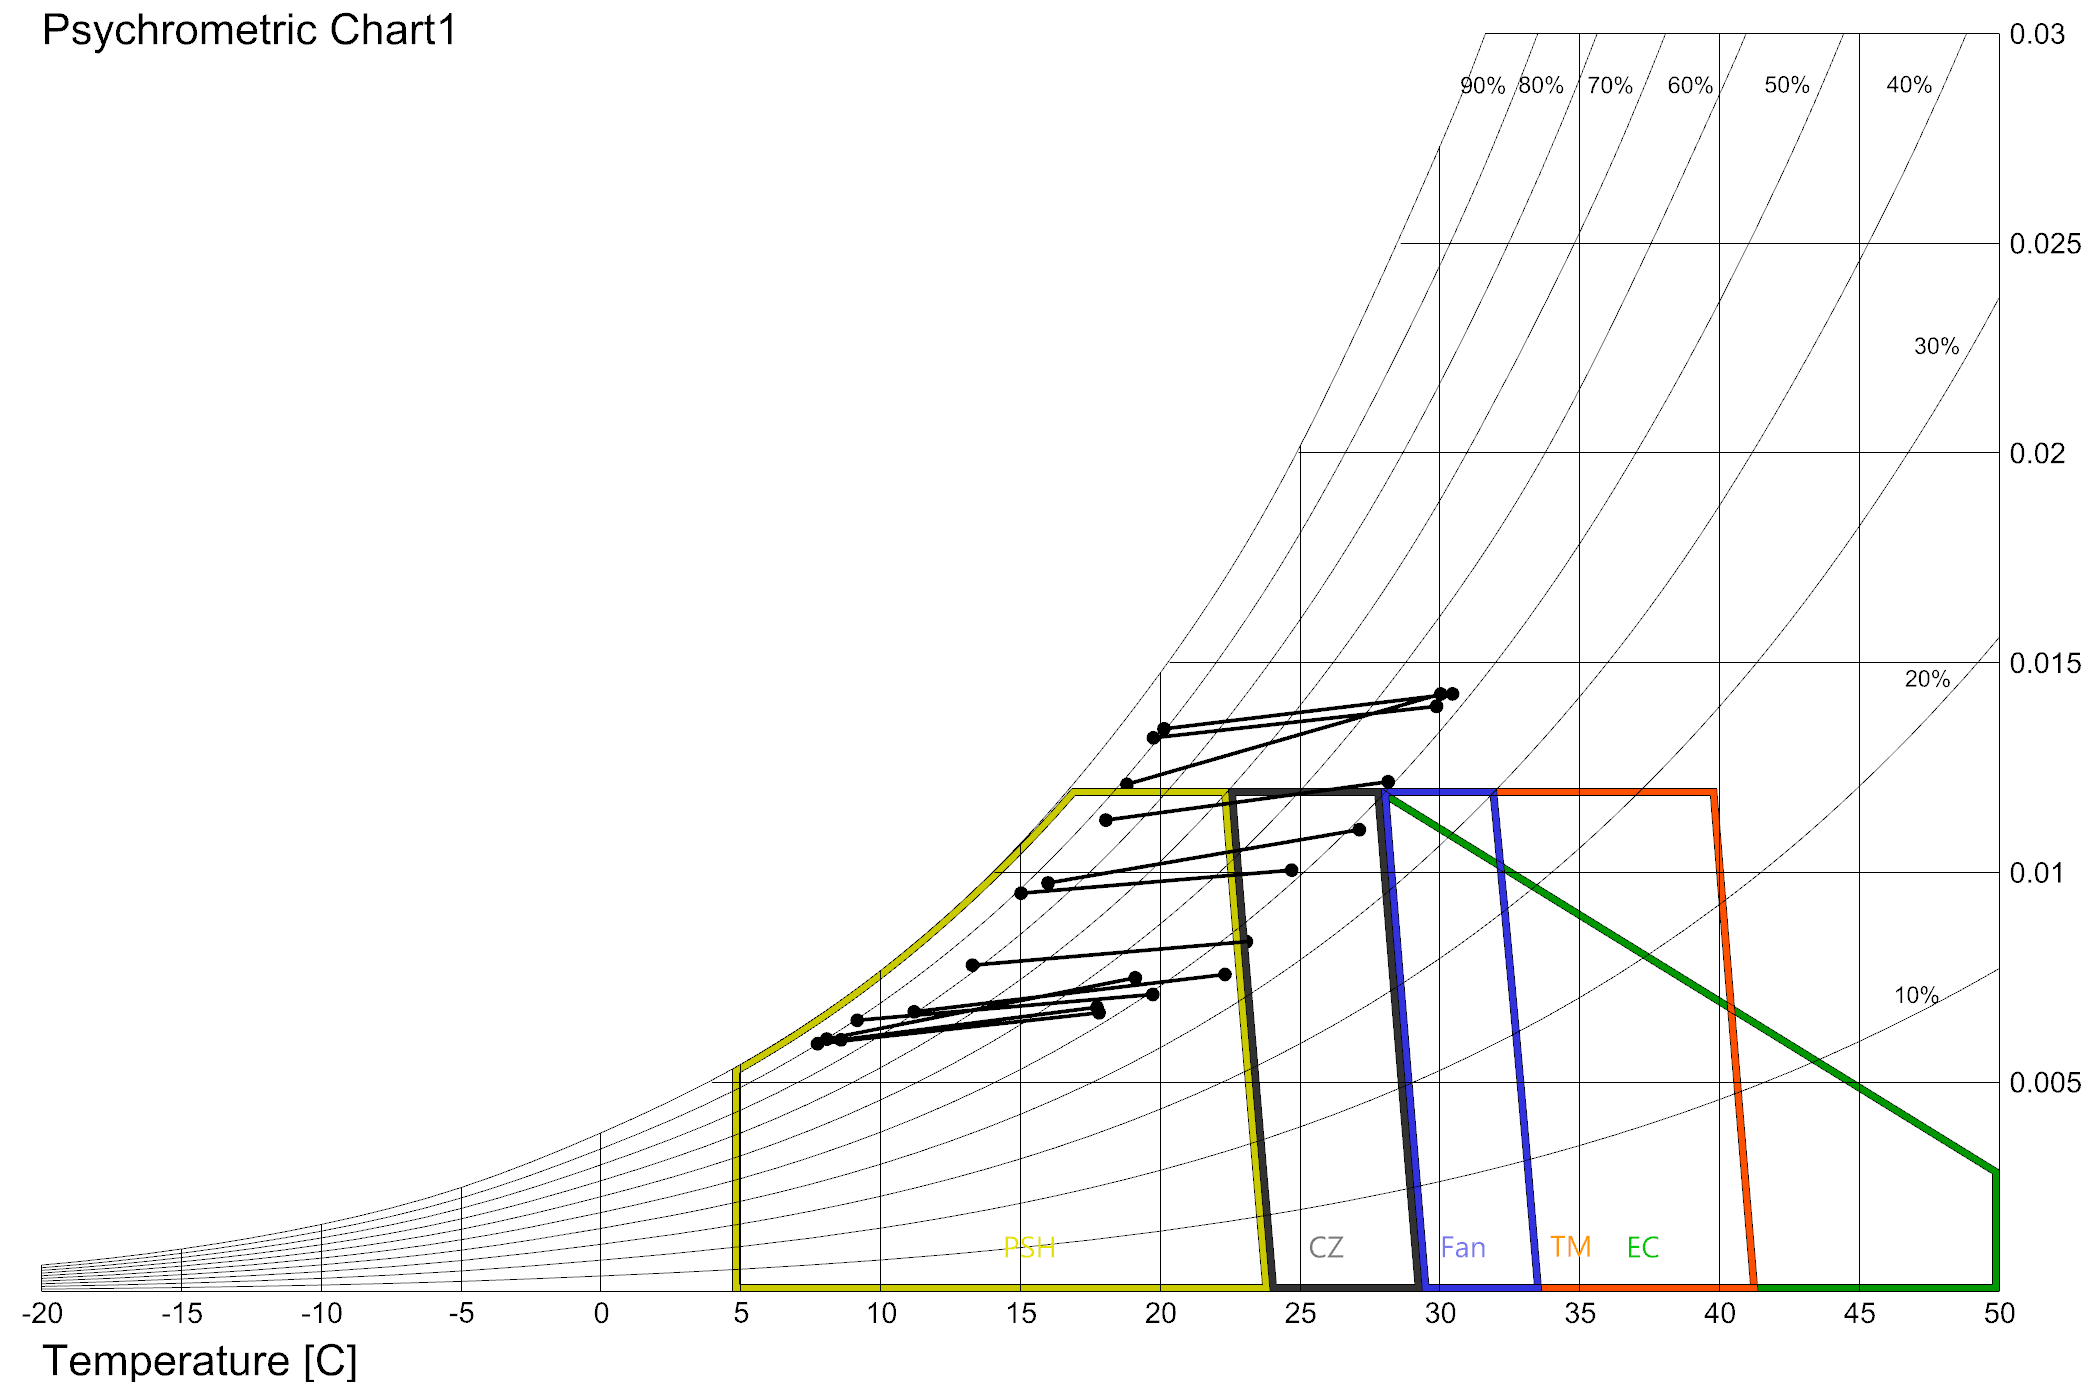
I need to plot in the psychrometric chart just 2 couple of values: MinTemp/MaxHum and MaxTemp/MinHum.
To make things more complicated, sometimes those values will be external inputs (since there is no epw file for the location, but those extreme values are available).
In this discussion @chris suggested how to get the min/max average values from the epw file. This works just fine. The problem now is how to plot the values.
Will appreciate directions to explore.
Thanks,
-A.
Hi,
I think i managed to solve this, like so:
        # plot the data on the chart
        lb_points = psy_chart.data_points

        #""" #########################################
        temp_minmaxlines = []
        for ipt in range(0, int(len(lb_points)/2)):
            temp_minmaxlines.append( LineSegment2D.from_end_points( lb_points[ipt], lb_points[ipt + int(len(lb_points)/2)] ) )
        min_max_lines = [from_linesegment2d(tl, 0.0) for tl in temp_minmaxlines]
        #""" #########################################

        points.append([from_point2d(pt) for pt in lb_points])
The relevant code is between the long hash tags (###########).
The temperature/humidity data are the outputs of the other topic i referenced above (after creating a couple of new data types) and i added an additional output for the lines.
If you have a better option, i’ll appreciate to know.
Thanks,
-A.
1 Like
Hi @AbrahamYezioro,
Do you think it could be possible for you to upload the gh file? I cannot figure out how to obtain this type of chart in Ladybug/Grasshopper.
Thanks
Hi @Julioamodia89 ,
Attached the GH that calculates and plots the min/max lines.
-A.
Psychrometric_MinMax_Lines.gh (35.6 KB)
1 Like
Hi @AbrahamYezioro I have developed this workaround. I am confused about the min max values. Should it not be coincident? I mean, the max hour for dry bulb temperature does not necessarily match with the min relative humidity, right?
Julio
Max min monthly psychometric.gh (43.1 KB)
Hi @Julioamodia89 ,
Nice workaround. The only thing is that it takes average values instead of the real values. If you overlap both versions, there are some gaps between them. They are small so if you are good with your version it is fine.
Not sure i understood the question. In general, max temperature matches min RH and viceversa. They not necessarily coincide in the hour, but probably they are close.
Is this what you meant?
-A.