First of all, I just want to confirm that PPD represents the percentage of “Dissatisfied”, whereas TCP presents the percentage of “Comfortable (Satisfied)”. In other words, the concepts of the two are opposite, correct?
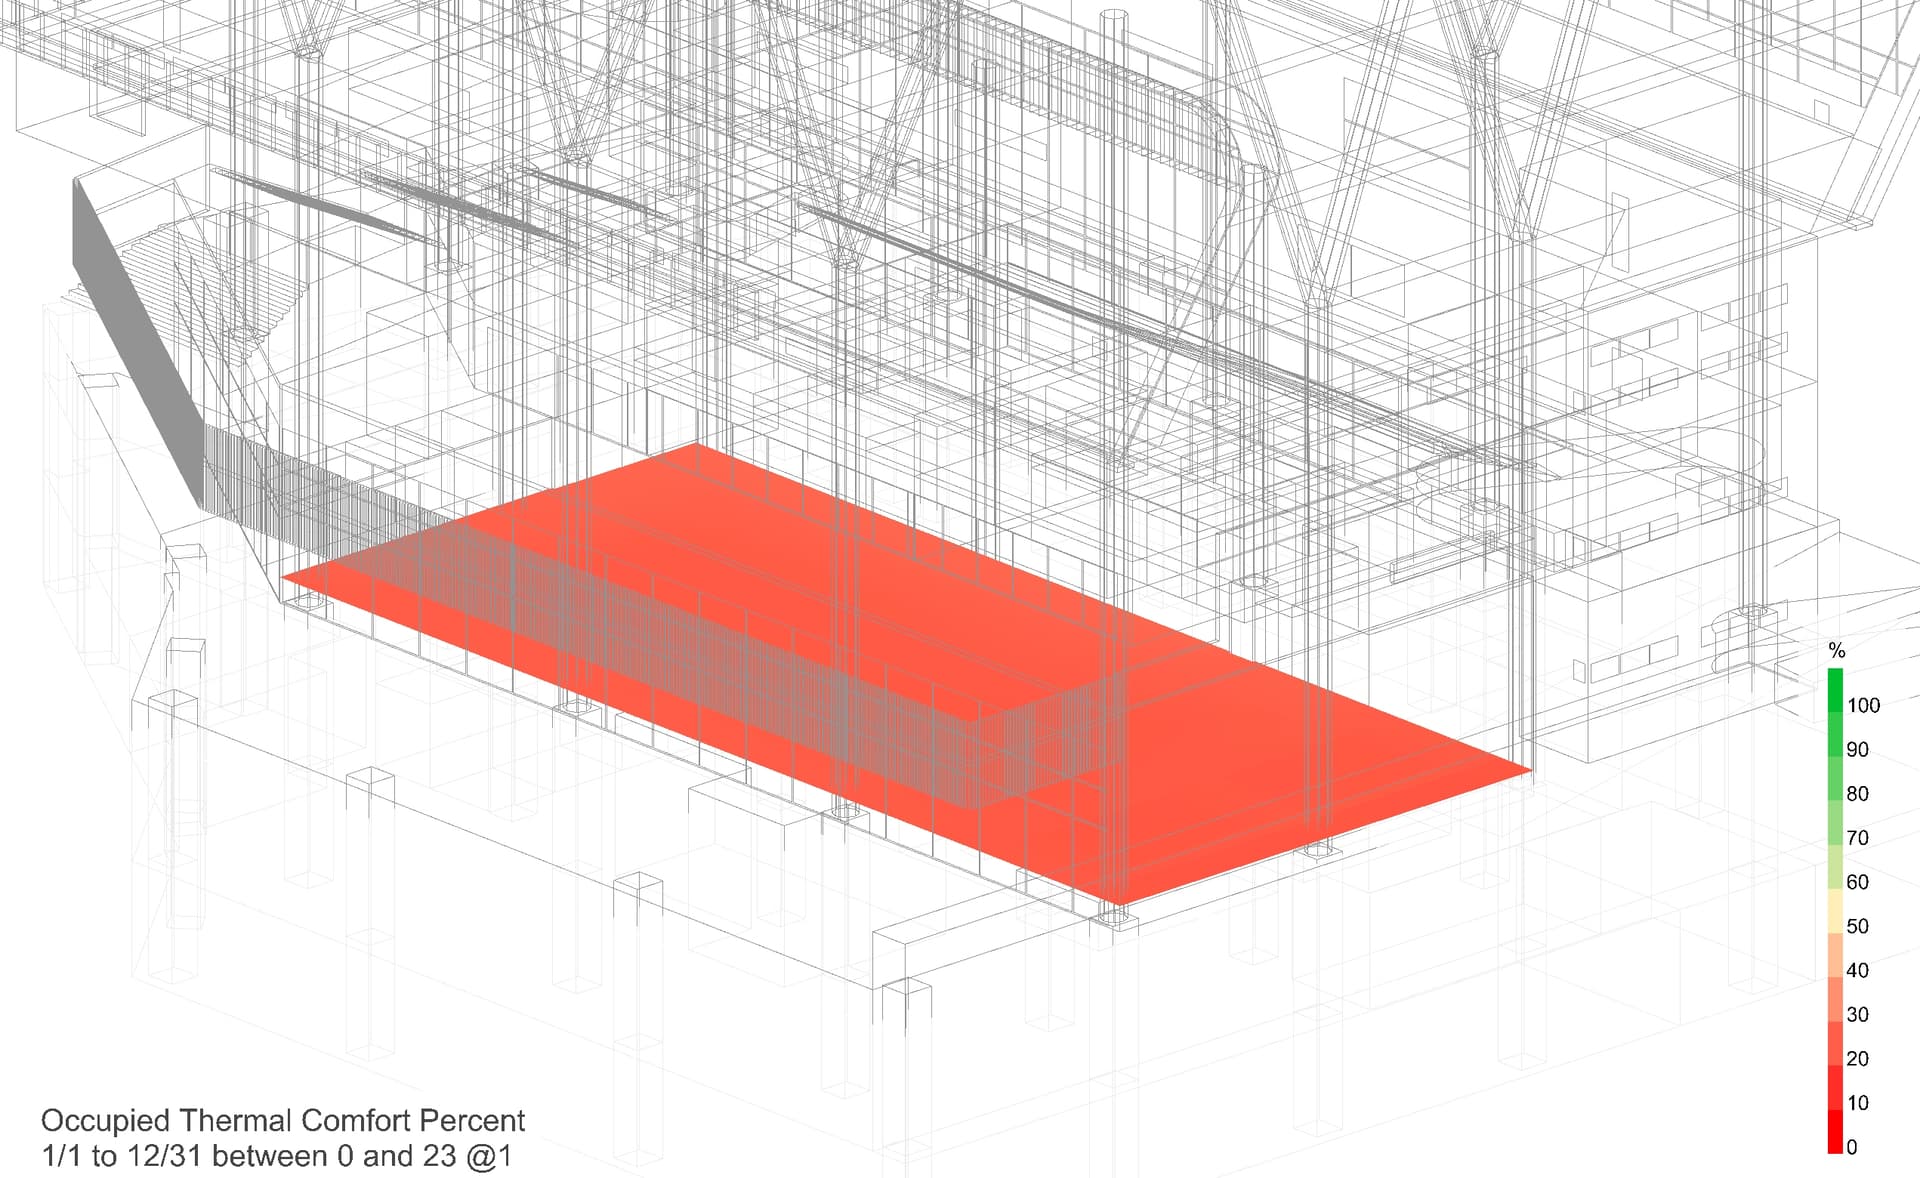
If the understanding above is correct, I am trying to figure out why the same room shows almost 0% PPD (100% comfort according to the comfort object) but only about 10% in TCP.
I’ll admit that those results initially seem contradictory, particularly because those legend bounds wipe out most of the detail of the study. But its totally possible for these results to happen because TCP and PPD are very different metrics and it’s not as straightforward as one is the inverse of the other.
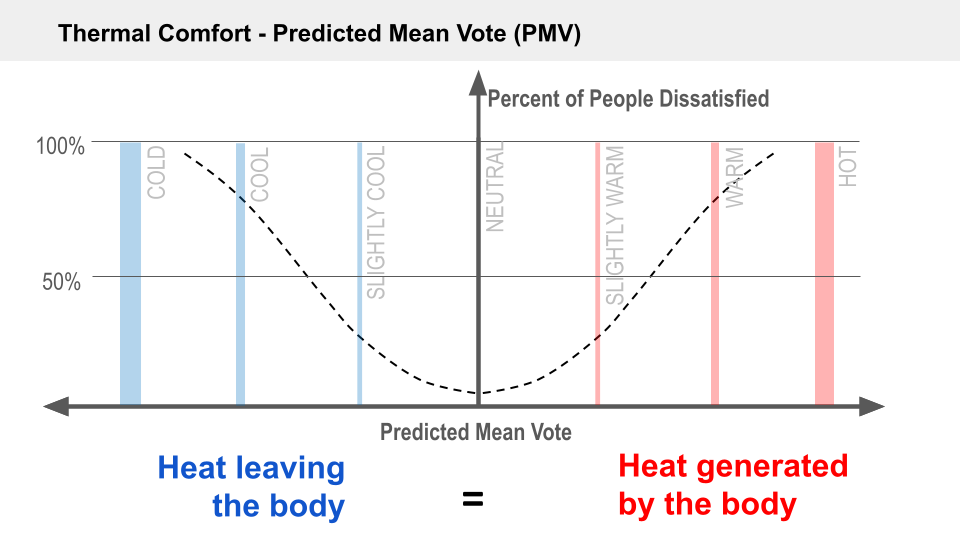
Percentage of People Dissatisfied (PPD) is a metric that Fanger came up with that is directly related to PMV. Essentially, Fanger found that, even when the average “thermal sensation vote” across his climate chamber subjects was 0 (for perfectly neutral thermal sensation), there were still about 5% of his subjects that reported feeling either slightly cool or slightly warm. So he decided that a PMV of 0 would correspond to a PPD of 5% and used a normal distribution to estimate PPD from his PMV equations. So a PMV of /-+0.5 meant roughly 10% PPD, a PMV of +/-1.0 meant a PPD of 20% and so on. This visual might help understand the relationship between the two:
The important thing to recognize is that PPD is a point-in-time style of metric. It is not an annual thermal comfort metric and, when you compute “average PPD” over a long time period like your graphic, you are mixing the high values with the low values and loosing a lot of the detail.
Thermal Comfort Percet (TCP) is an annual thermal comfort metric, which is defined somewhat similarly to annual daylight metrics. Essentially, TCP is the percent of occupied hours where conditions fall within a given standard of acceptability.
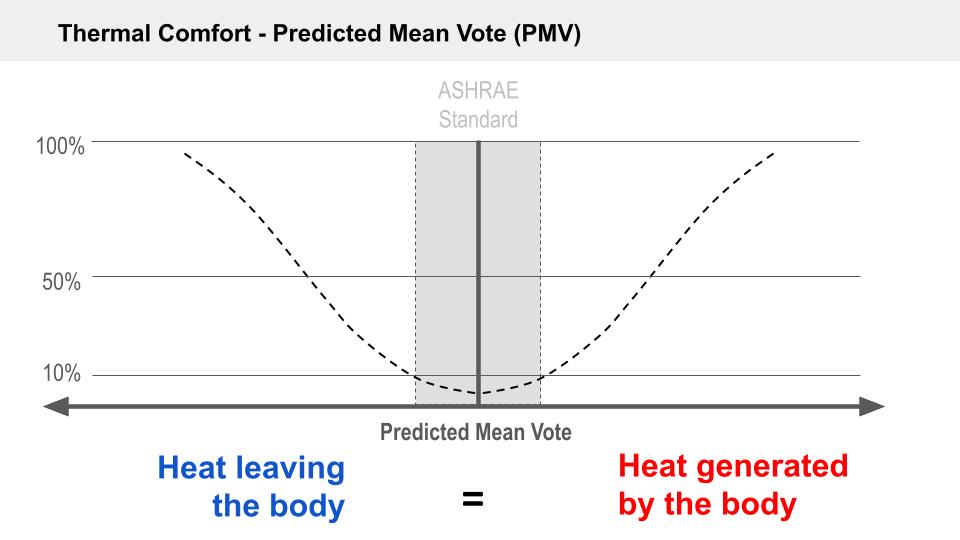
The default standard that the Honeybee PMV comfort maps use is the ASHRAE-55 thermal comfort standard, which states that conditions are considered “acceptable” if the PPD of those conditions is less than 10%. You can picture the ASHRAE standard like so:
So, if your results there are showing that ~25% TCP, this means that 25% of your occupied hours (taken from your energy simulation schedule) meet the ASHRAE-55 standard of having less than 10 PPD. Granted, it seems like you aren’t too far off from meeting the standard and maybe you have a lot of cases of 12 or 15 PPD. But even though these are close, they don’t count towards your TCP.