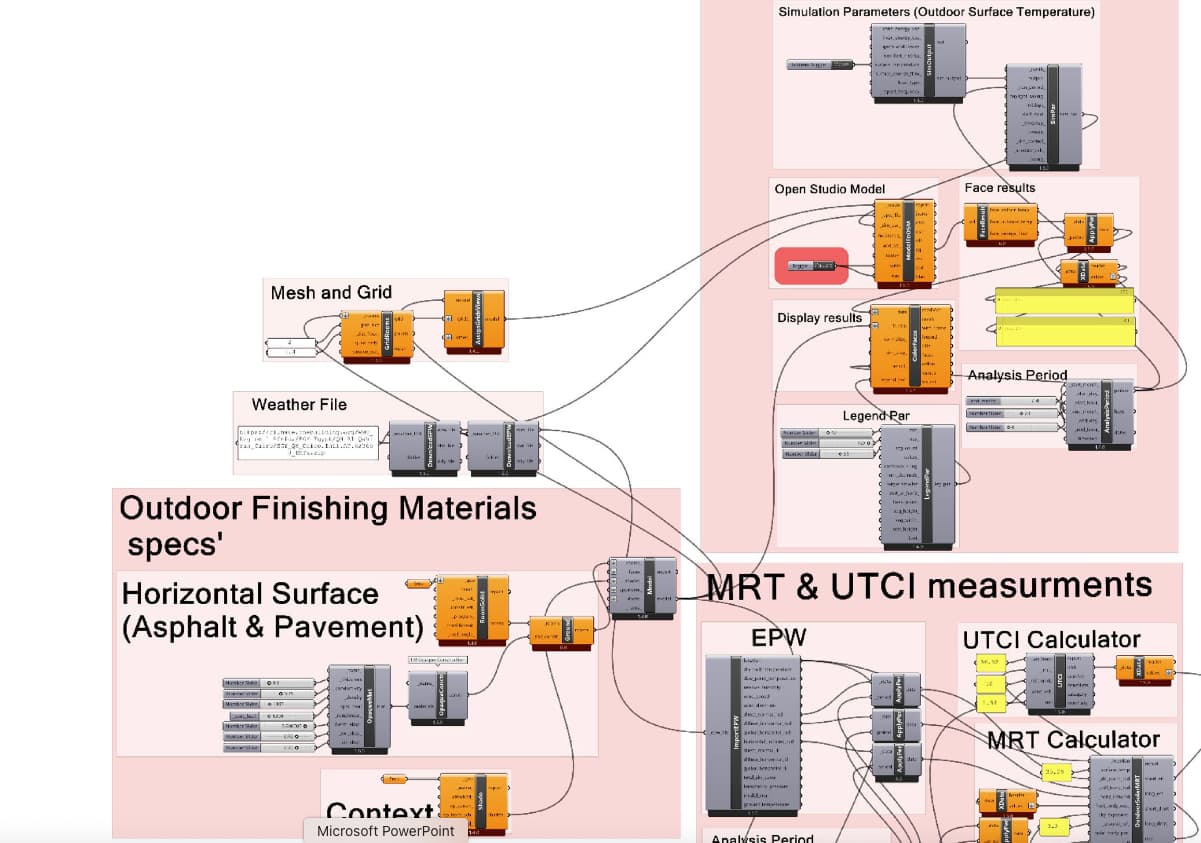
I attempted to simulate pavement surface temperature using Honeybee and EnergyPlus. In my model, I constructed the pavement geometry using HB Room, applied HB Ground, and then connected the simulation workflow using SimOutput, SimPar, and Model to OSM to obtain the outside surface temperature results.
However, I encountered a puzzling issue during the simulation. On July 19th, the calculated ground surface temperature at noon is unexpectedly low (around 22°C), even though the solar radiation and other meteorological conditions clearly correspond to typical summer conditions. Interestingly, the ground surface temperatures at neighboring days appear quite reasonable, reaching around 45°C, which is consistent with expectations for summer ground surfaces. I am not sure if the method is suitable, and the calculation of energyplus is stable?
If you are not getting EnergyPlus warnings (orange component), then yes, the simulation is stable.
I have a sense that this is probably the result from not realizing that the hours before the lower temperature are actually cloudy but there is no way to be sure unless we have a minimal sample file to recreate your case.
Thank you very much for your reply. It really gave me some hope at a time when I was feeling quite confused.
In my model, I created an HB Room, applied HB Ground, and then connected the simulation workflow using SimOutput, SimPar, and Model to OSM to obtain the outside surface temperature results.
In the results, I obtained 34 surfaces. The roof surface on the top of the HB Room is what I consider to be the road surface. Only this surface shows temperature variations, while all the other surfaces remain constant at 18°C at all times.
I am using the Barcelona Airport weather data (EPW) for the simulation, and I noticed that the simulated road surface temperature on July 19 appears to be abnormal, which is what made me start investigating the model.
At the moment I cannot open the Grasshopper file, so I am only able to send you screenshots for now. I will send you a sample tomorrow morning and would really appreciate any advice you could give me.
I truly need your help.
Thanks again for your time and support.
This is a simplified flowchart, and I have also attached the weather and climate conditions that I would like to include in the test. If possible, could you please help me run the test?
Because the tests over many days have been unstable—for example, at noon on July 19 the road surface temperature was only about 20°C, while the normal calculation should reach over 40°C.
I really need your help. Thank you very much for the trouble. Simple Sample - Surface Temperature .gh (53.6 KB) ESP_CT_Barcelona-El.Prat.AP.081810_TMYx.2009-2023.epw (1.5 MB)
I am currently facing an issue with my simulation and would really appreciate your help.
On July 19th, although all climate parameters seem normal, the surface temperature at noon becomes lower than the air temperature. This does not happen on the neighboring days (July 18th and July 20th), where the results look reasonable.
I am not sure whether this is caused by a modeling issue or something related to the simulation setup. If you have time, could you please help me check or test the model? I would be very grateful for your assistance.
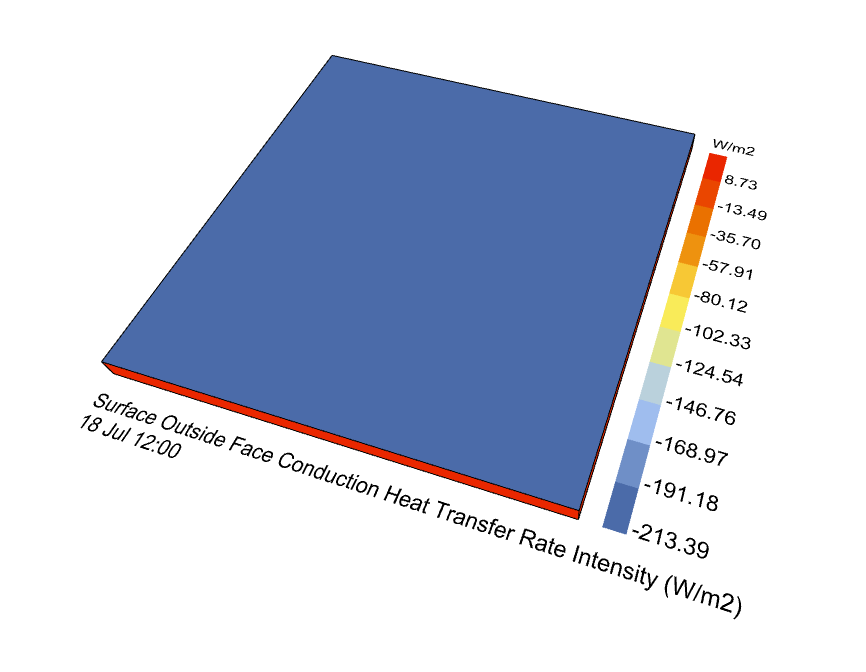
Sorry for the late response. You are right that the 18th and 19th in the EPW file are pretty similar (including dry bulb temperature, solar radiation, and wind). From what I can see, the incident solar on the model seems roughly the same between the two days. But I can see that a lot of the heat is conducting into the pavement on the 18th:
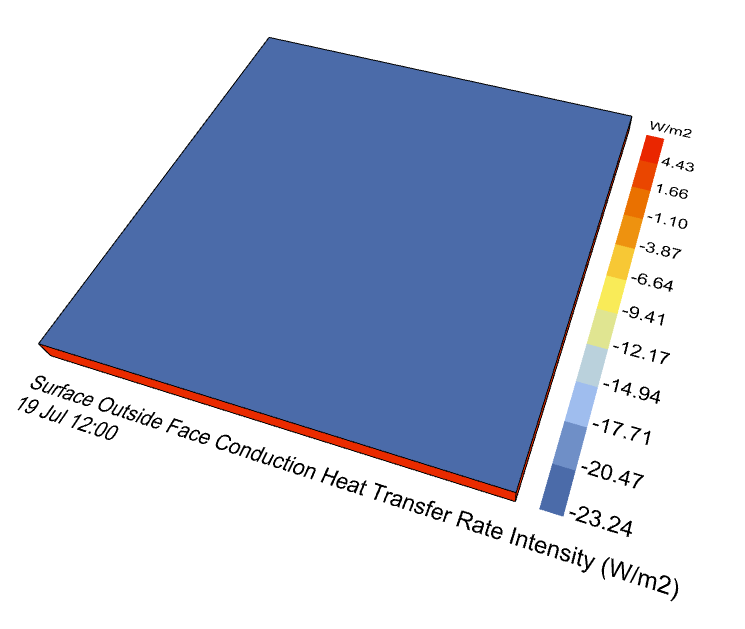
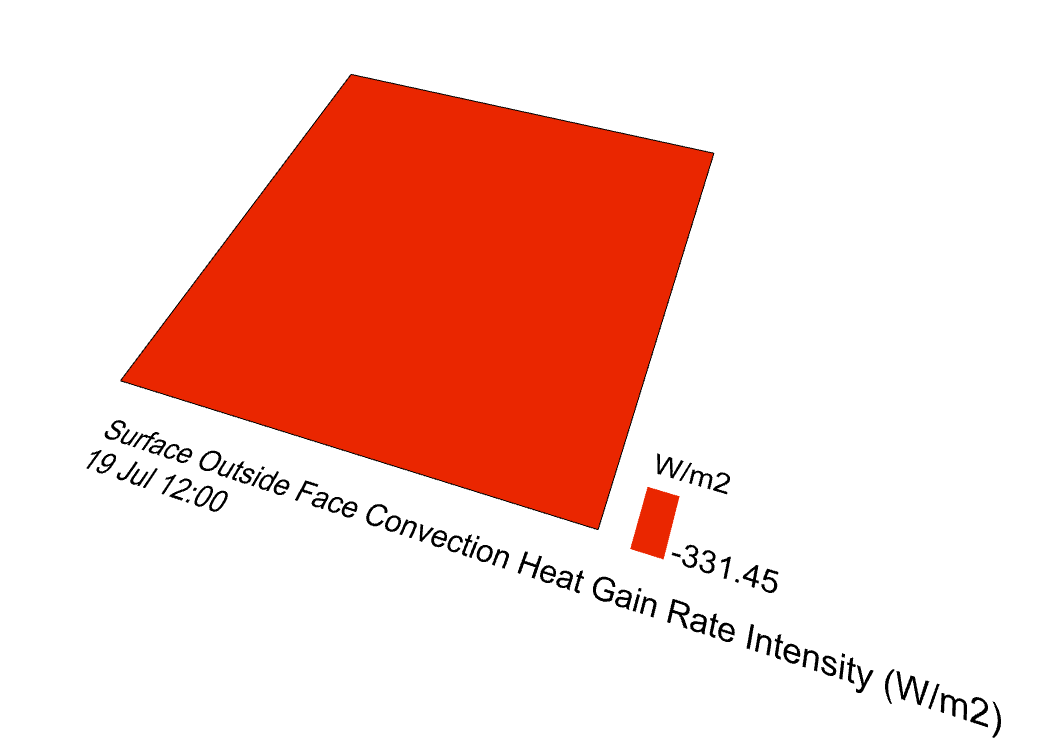
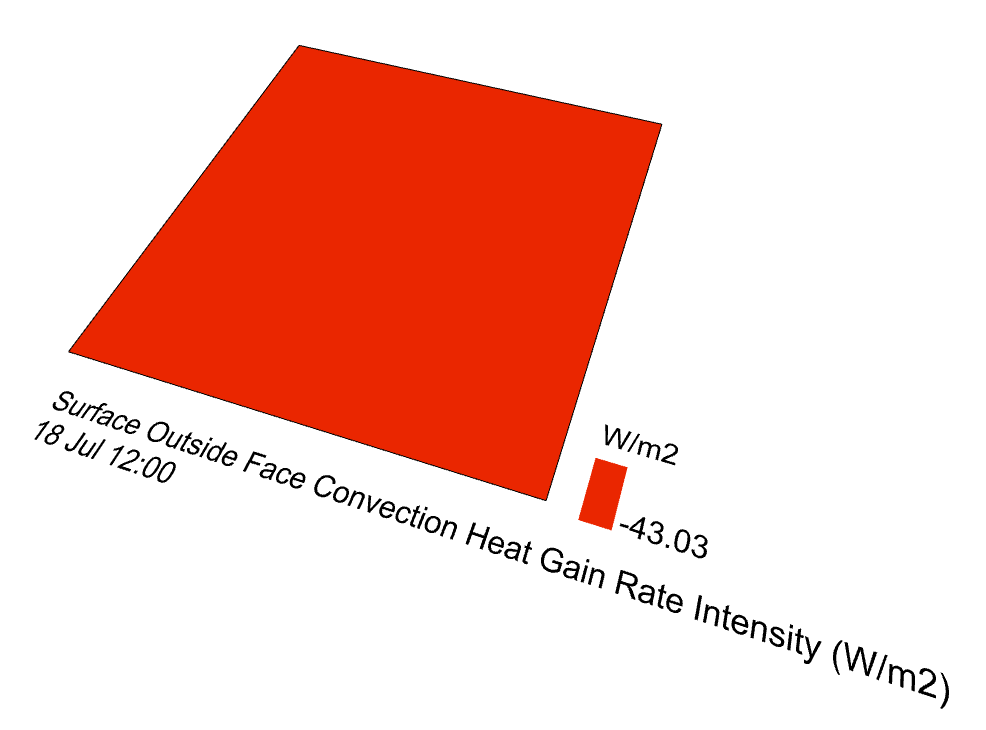
So something is happening to remove the solar heat absorbed by the pavement before it conducts into the construction. I can see that a lot of it seems to be convecting away on the 19th:
So I think the difference here may have something to do with how the model is interacting with the slightly different wind speeds and directions between the two days.
Thank you very much for your patient and detailed reply. It has been incredibly helpful for us as early-stage researchers, and I truly appreciate your support.
Based on my previous checks of the meteorological data and your suggestions, I believe the model may be overly sensitive to small variations in wind direction, wind speed, and cloudy conditions. Therefore, for the next stage of simulations, I plan to use data from the mountain weather station, which has relatively stable cloud cover, wind speed, and wind direction, in order to obtain more consistent and reliable results.
Thank you again for your kind assistance. I wish you all the best.