I am conducting research on optimizing buildings using Wallacei.
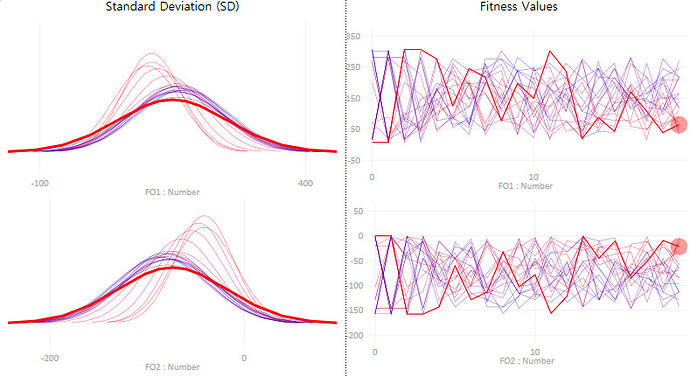
Wallacei is capable of various analyzes as shown in the picture below.
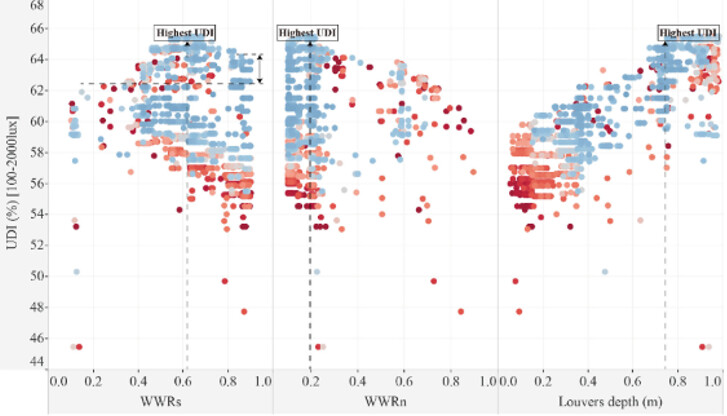
However, I want to create a scatterplot between the objective function and the parameter as shown in the figure below.
Do I need to use Excel for this analysis rather than Wallacei?
If so, how can I transfer the optimization results to Excel?

