Hi,
I hope everyone’s healthy,
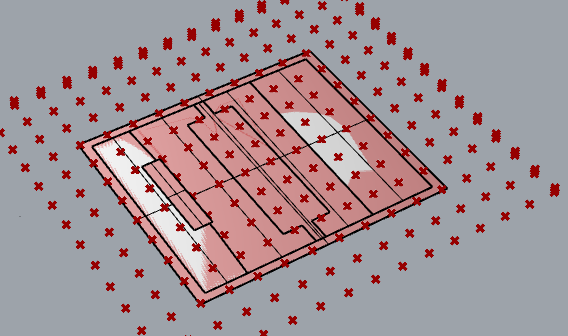
I am using Dragonfly, the great work by @AntonelloDiNunzio to analyze thermal indices in an open park with a simple geometry, which consists of different materials.
I have completed the ENVI-met simulation and I have the following questions regarding reading and visualizing the results in the grasshopper:
- To visualize the results, I am using
DF Envimet Read Grid Resultsand in its descriptions, it says:
Connect the output of this component to
LB Recolor Meshto visualize data.
What should I connect to the _inputMesh input of this component? (or, how to create mesh from ENVI-met Grid?)

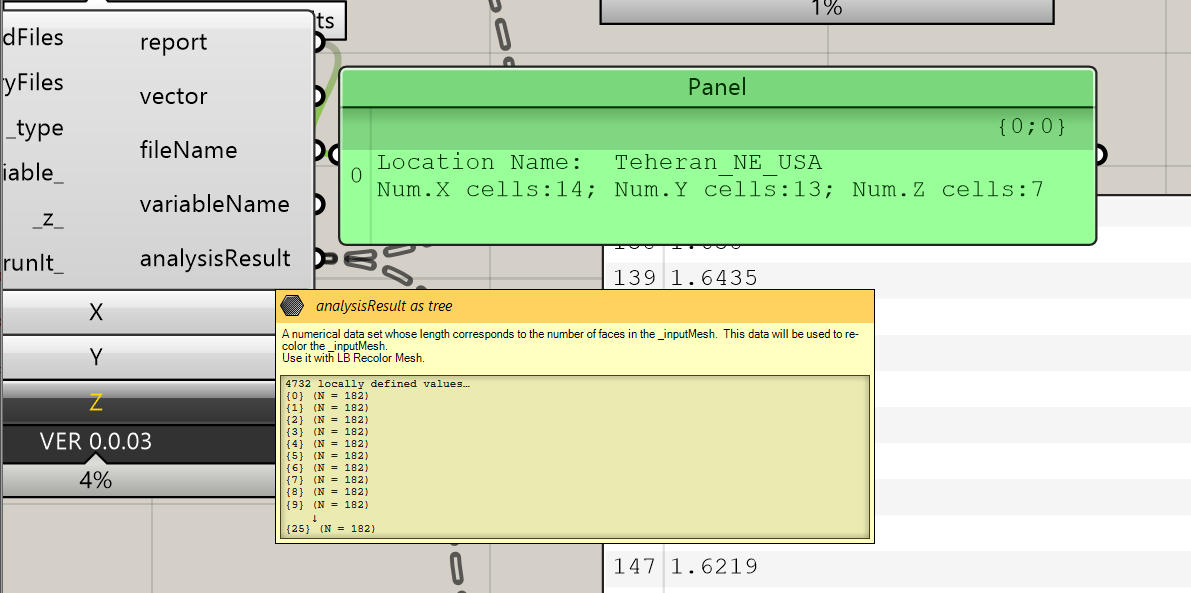
2. Also about the results, I have a problem understanding the data structure.
for example in my recent file (the screenshot below), I understand that “182” is the number of points in Z grid. but, what does 25 refer to?
3. can I use ENVI-met for annual calculations?