The components are running successfully but I cannot see the values of the output generated in the list.
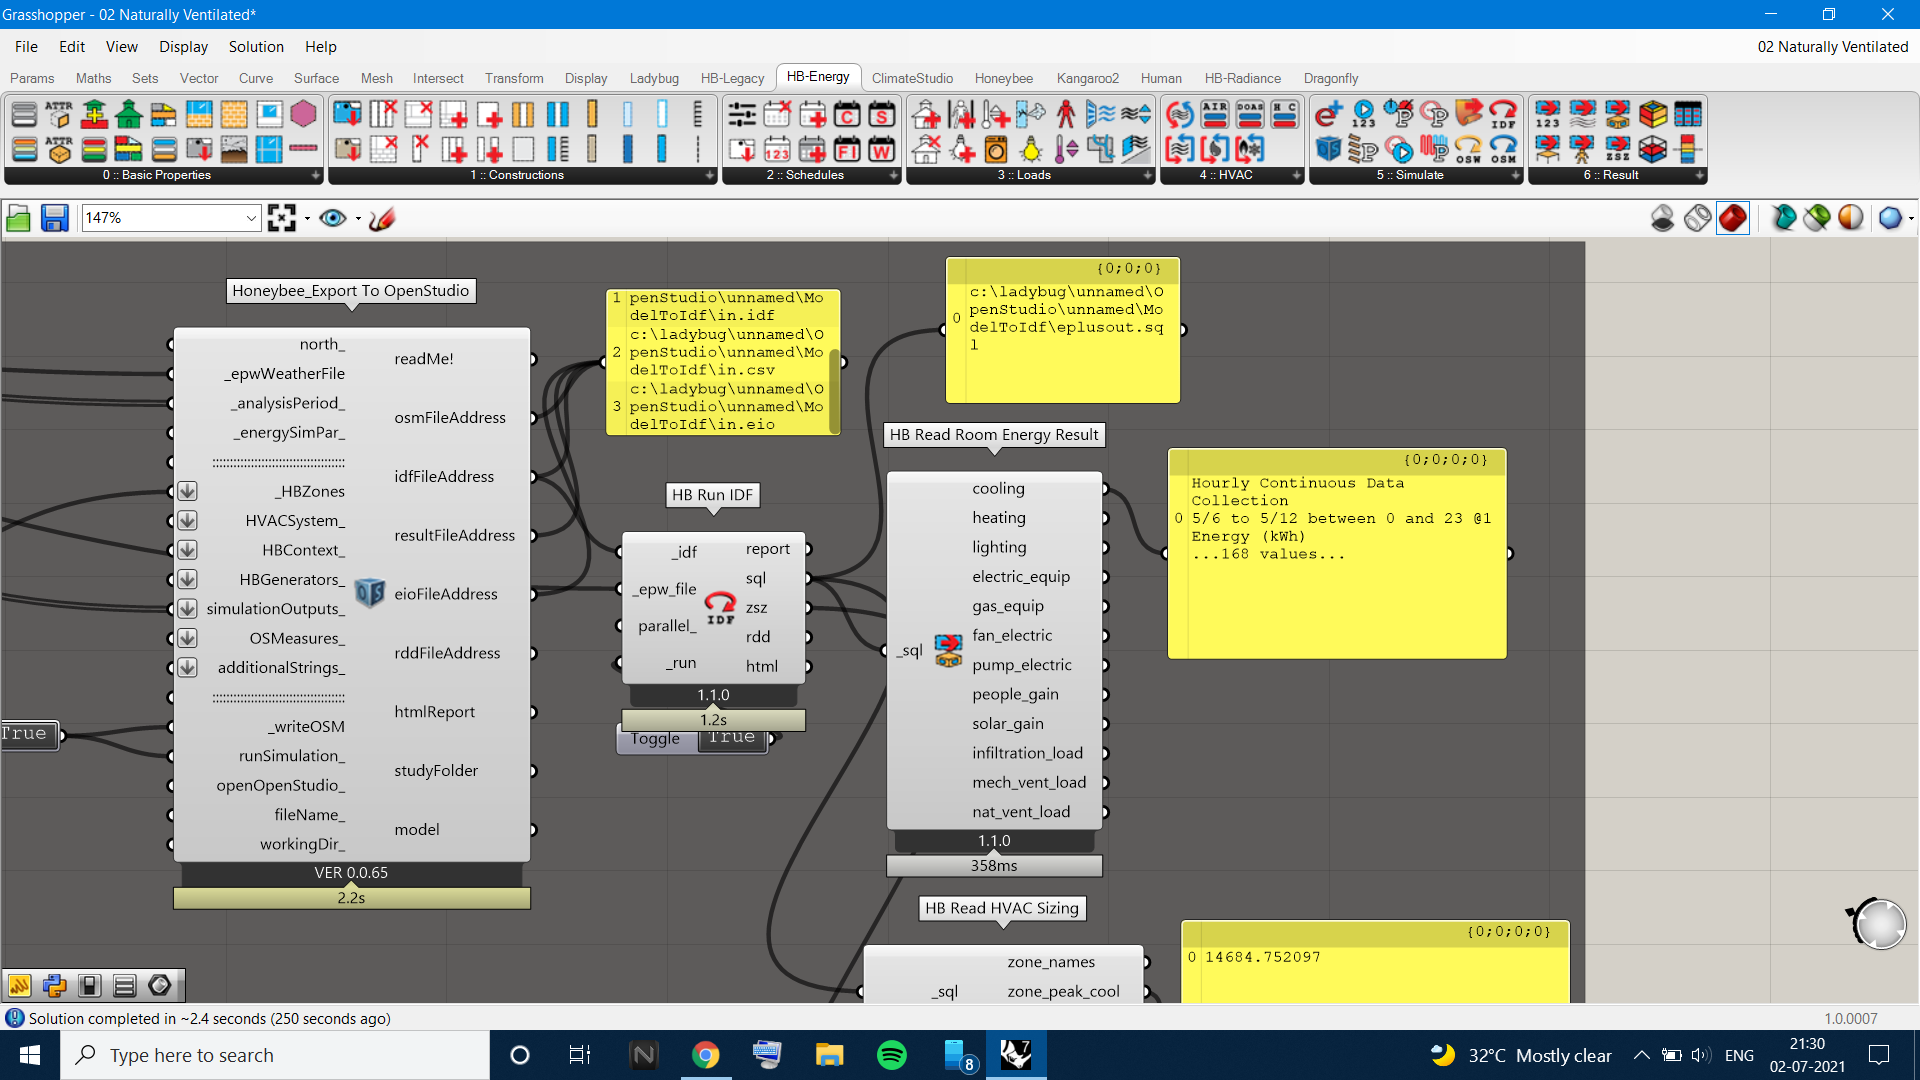
I am trying to study the peak loads in a given zone. The zones are conditioned and all the other outputs are visible, yet I cannot see the list of values in the result.
Is there another way I could get a graph and values of the cooling peak loads?
I would avoid mixing the Legacy and the LBT components, especially for this case here where there’s a “HB Model to OSM” component in the LBT plugin.
You can deconstruct Data Collections to get the list of numbers using the “LB Deconstruct Data” component.