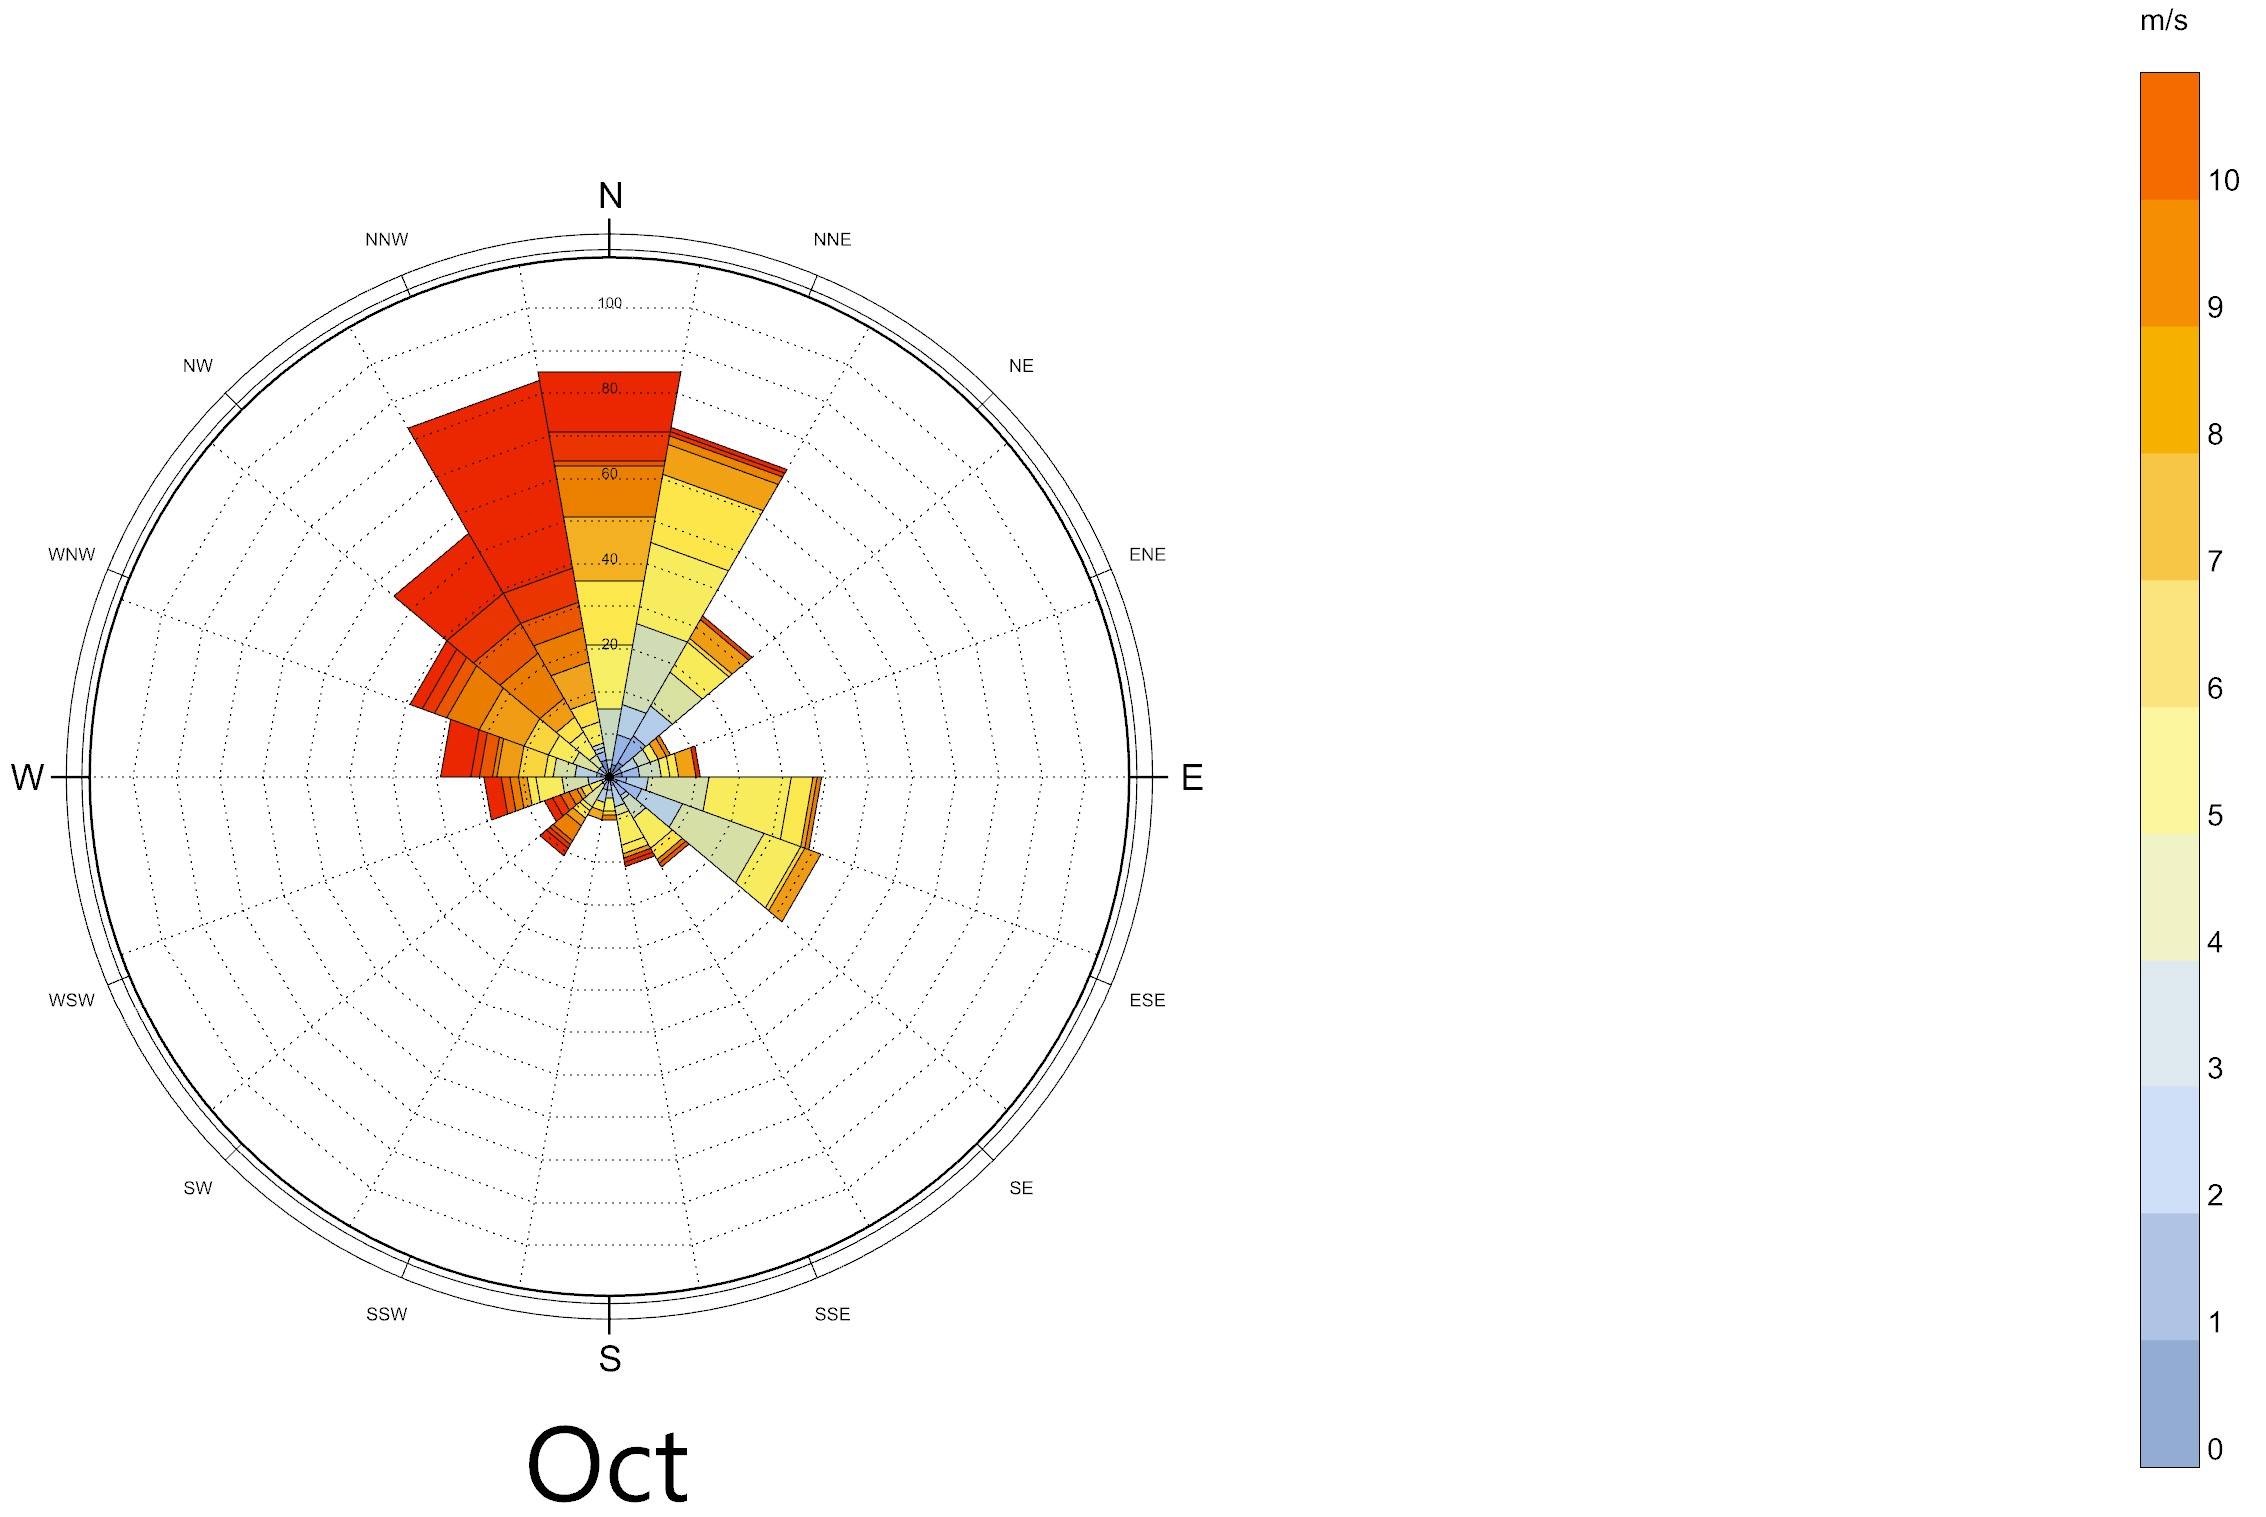
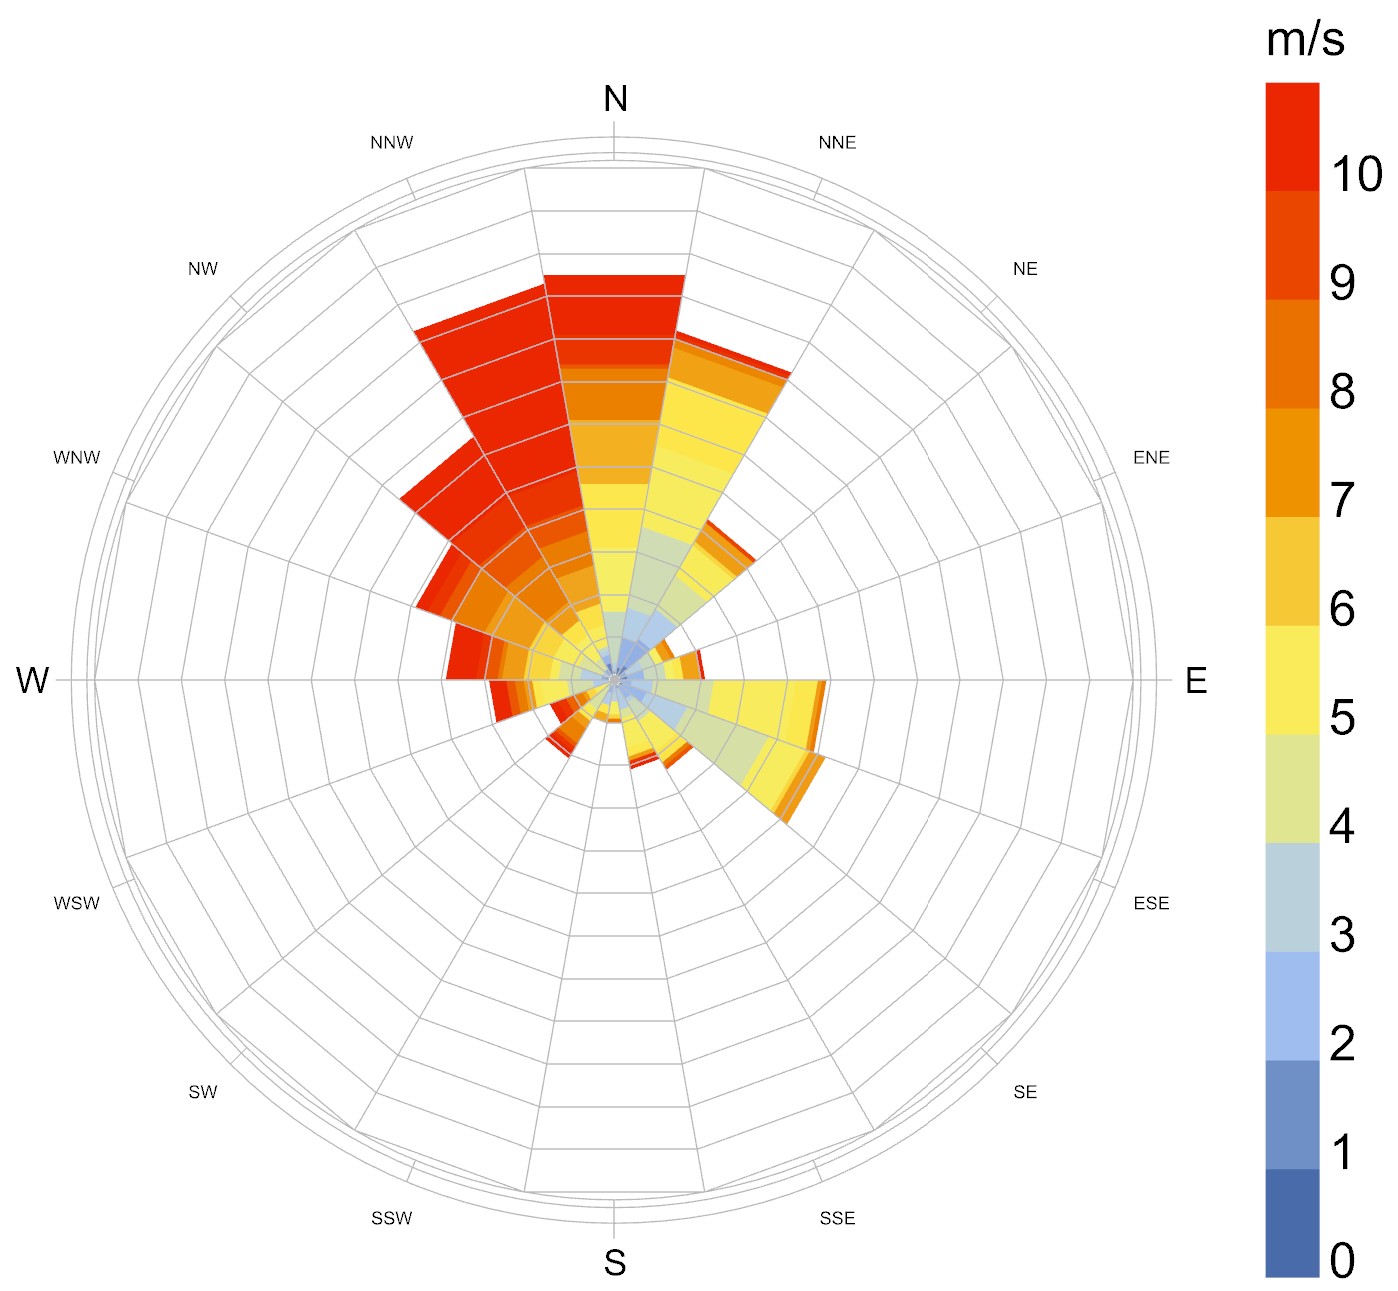
I’m noticing some differences between the color palette used in the visualization set geometries and the palette used for the visualization set legend.
You can see that both extremes in the legend are much “pale”. I guess that they start one or two steps after the min value and end one or two steps before the max value. Could it be?
It would be nice to get a consistent set of colors.
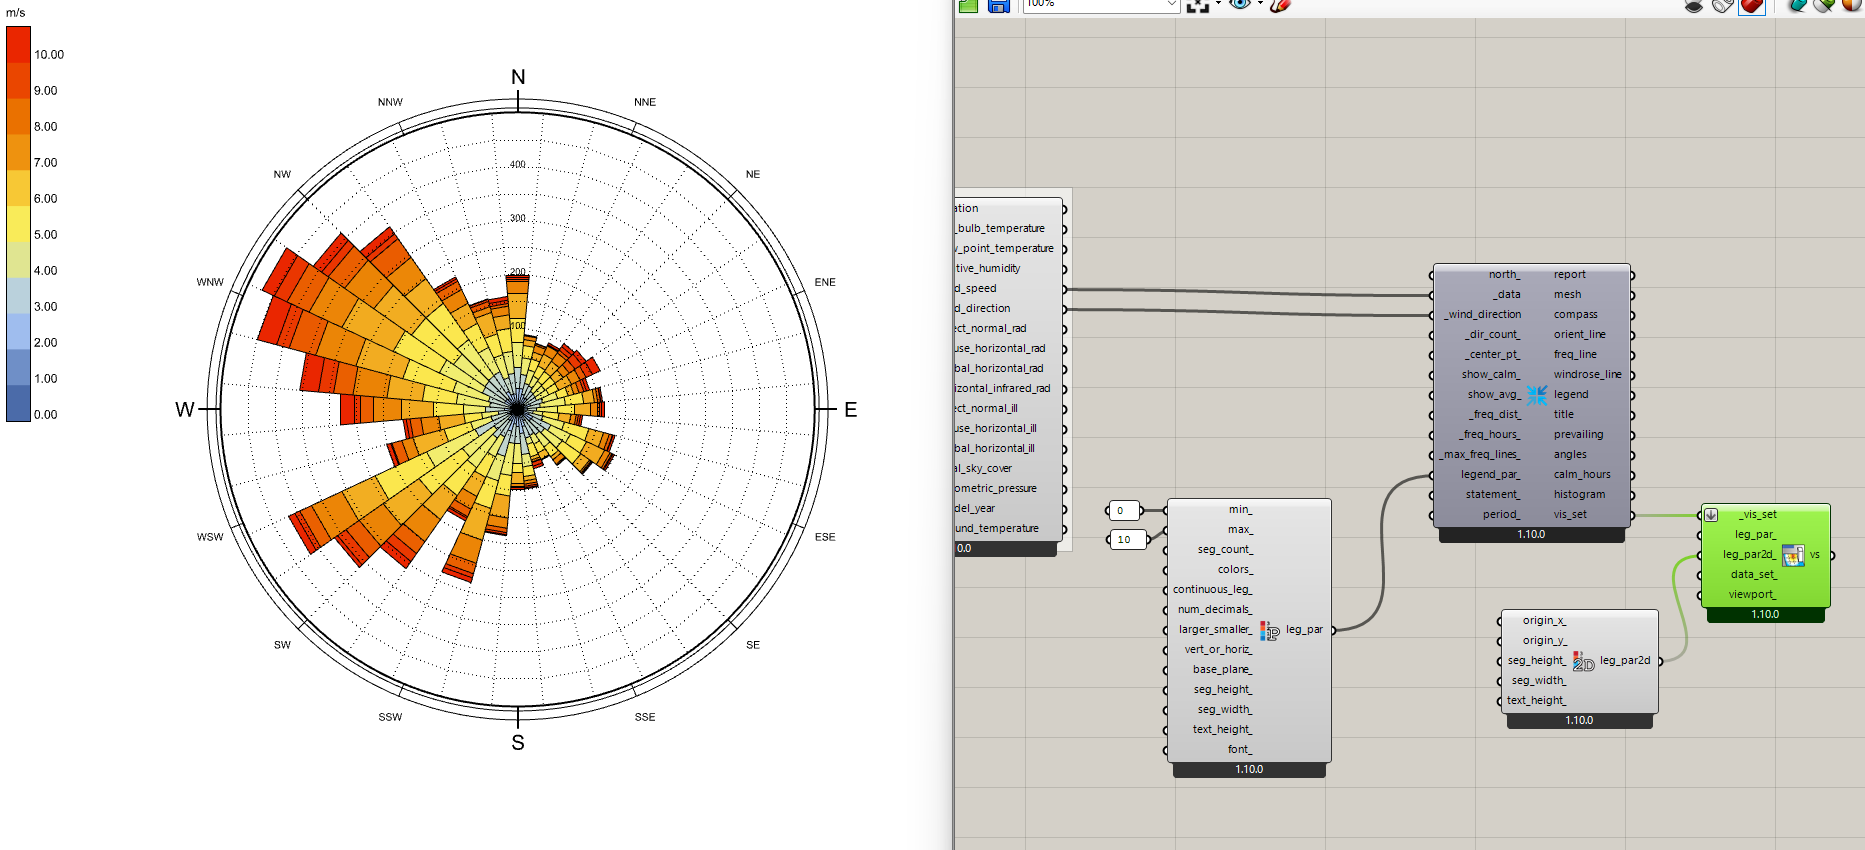
At first, after seeing your response, I thought I was getting into the mystery zone again. I opened the file where the issue was coming from, and it worked.
Then I noticed that it was showing the legend fine in shaded/wireframe views. But when switching to rendered [or similar], the issue appeared. But the image you posted shows rendered mode just fine.
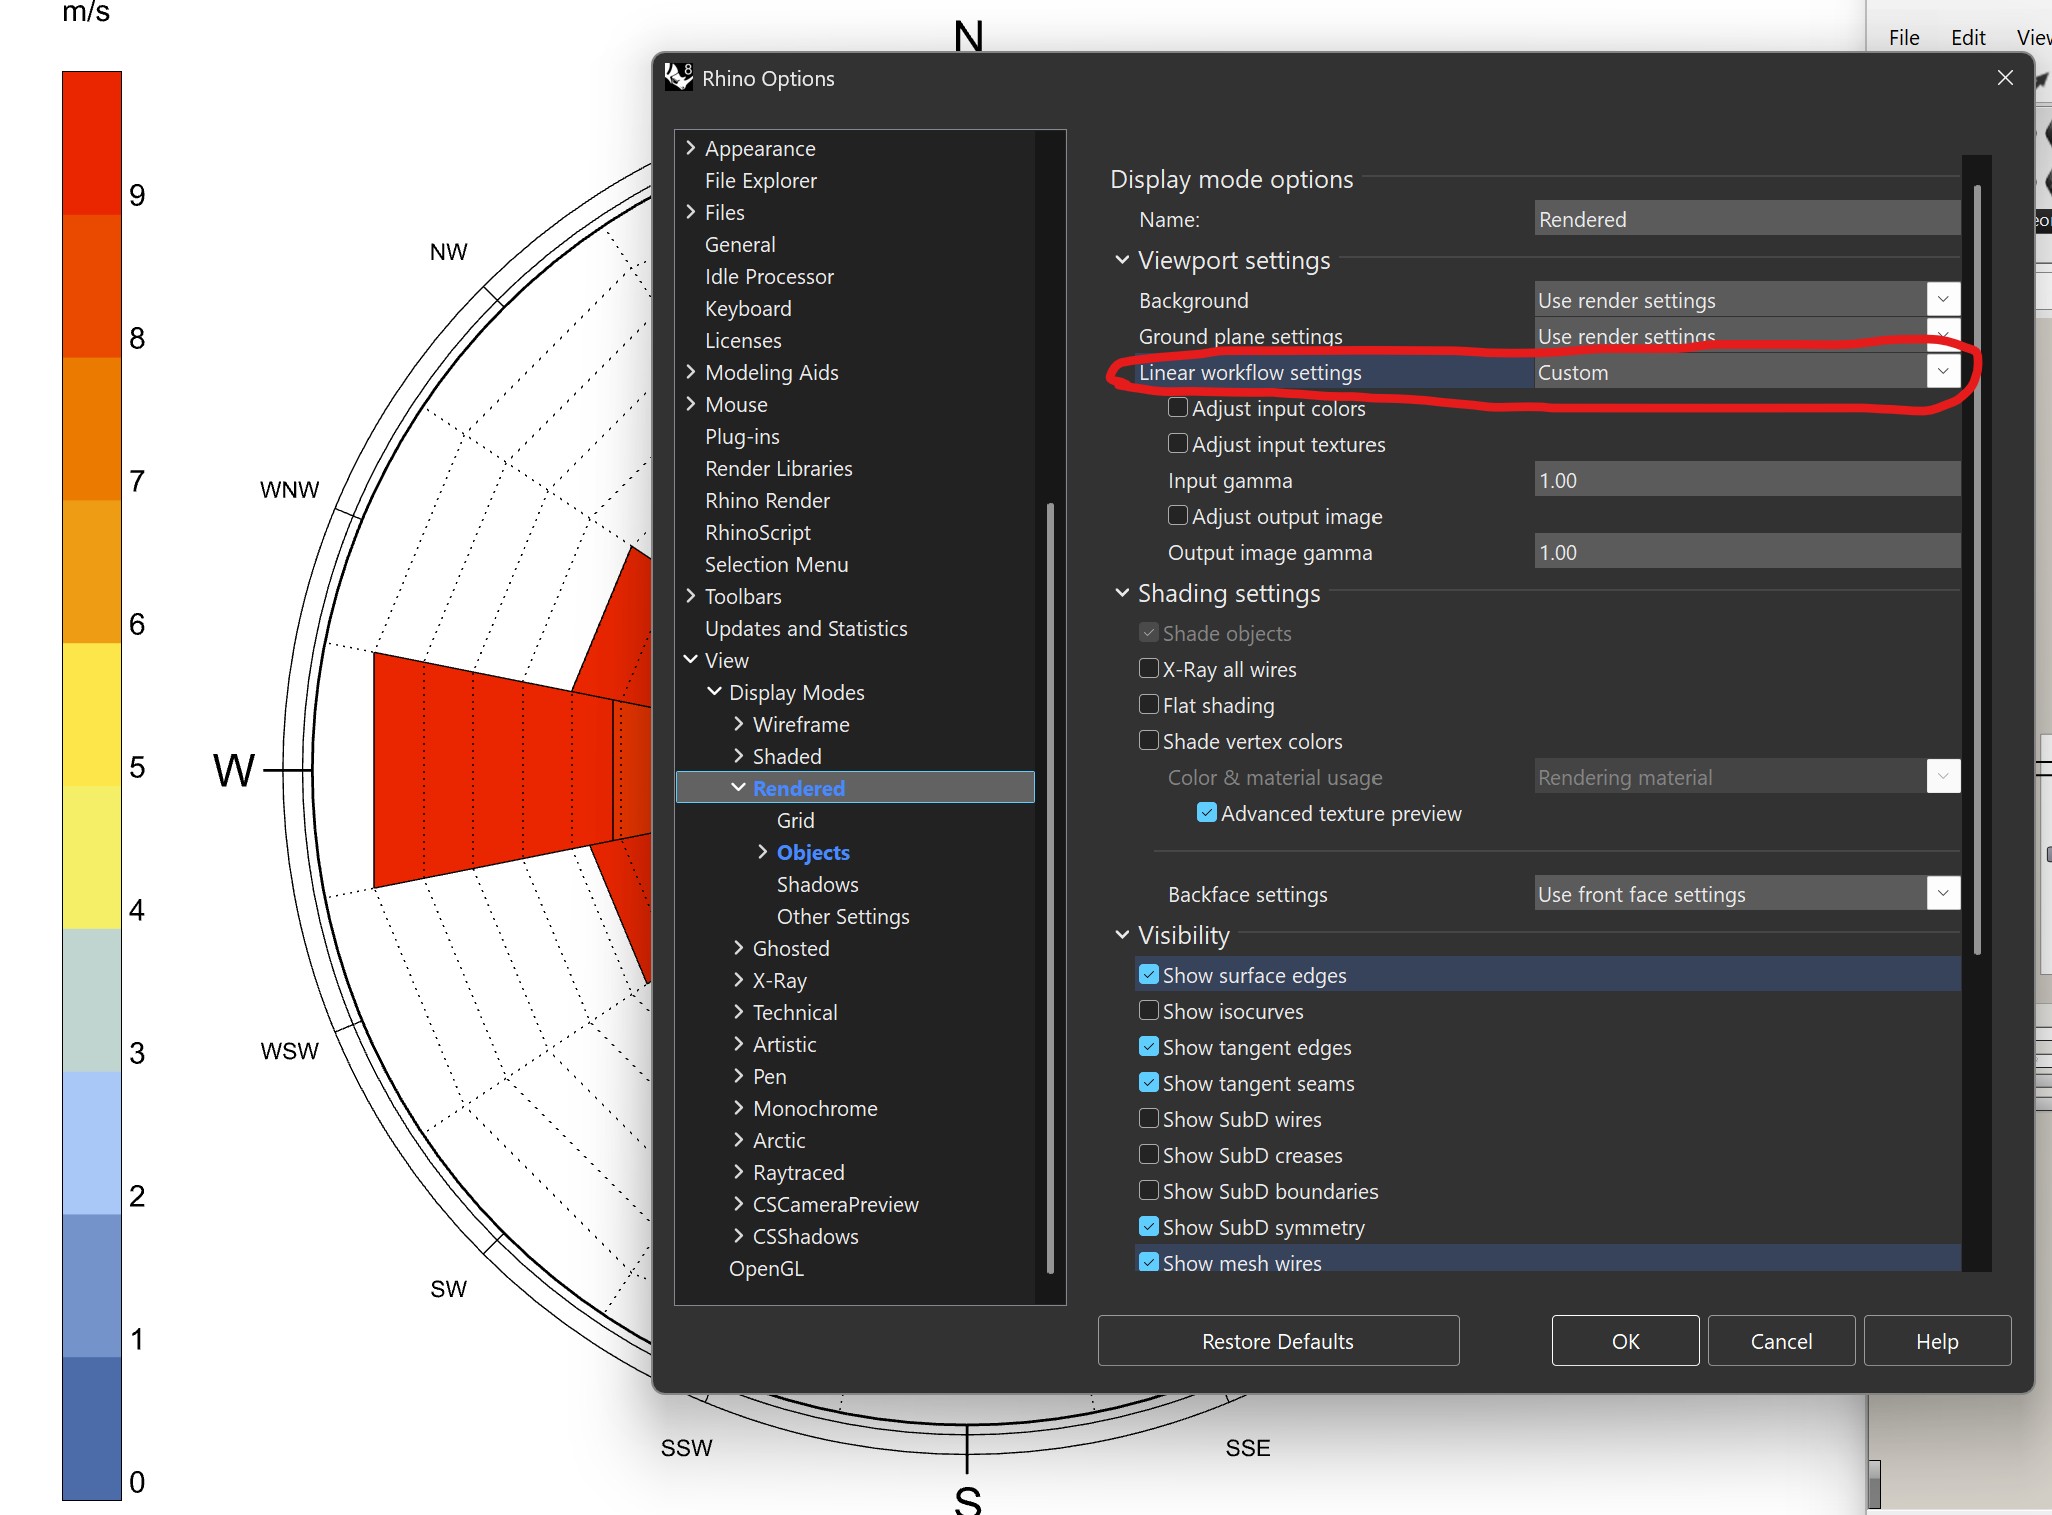
So, I went to the settings of the rendered mode and kind of reset it, and now the legend colors show as they are supposed to. In the image below I marked the setting that works fine in rendered view.