Hello,
I would like a small clarification on the low bound and high bound legend logic.
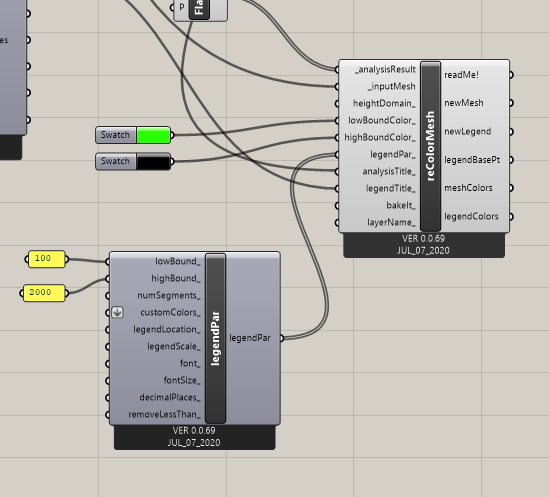
When I attach a color to high bound with setting upper limit to 2000lux, the assigned color shows up in the legend >2000lux as expected.
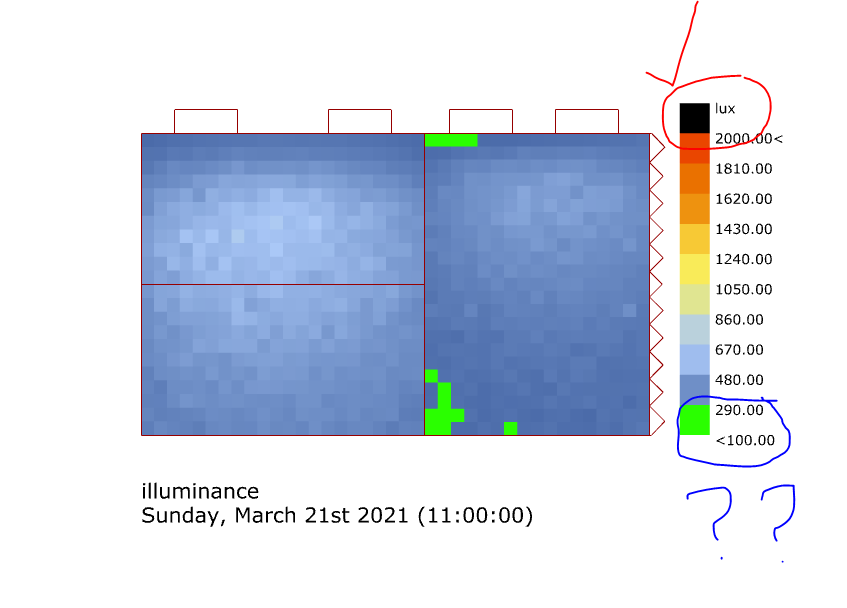
But when I do the same by adding color to low bound with lower limit of 100Lux, the assigned color does not show up below the 100lux segment as expected, but rather shows at the color segment which is between a range of 290 to <100lux (as per this example).
So as per the viz, the green path is perceived to be between range of 290 - <100 lux.
Is my understanding wrong or am I missing out on something??
Hi, anyone kindly help
I am still not able to understand this representation
I would just check the values from the daylight simulation for those sensors and will see which one is correct. You can use text tag component to map the values for each sensor.
To me it looks like the text for the legend is shifted down so that it doesn’t line up with the colors. starting from the bottom, the green is all the nodes <100.00 and then the darkest blue for 100 to 290, etc… I have noticed that the text for the legends is often shifted so the values don’t line up with the colors. I correct after baking the results in Rhino. I’m not sure if there is a way to do this in grasshopper.
Hi @mostapha ,
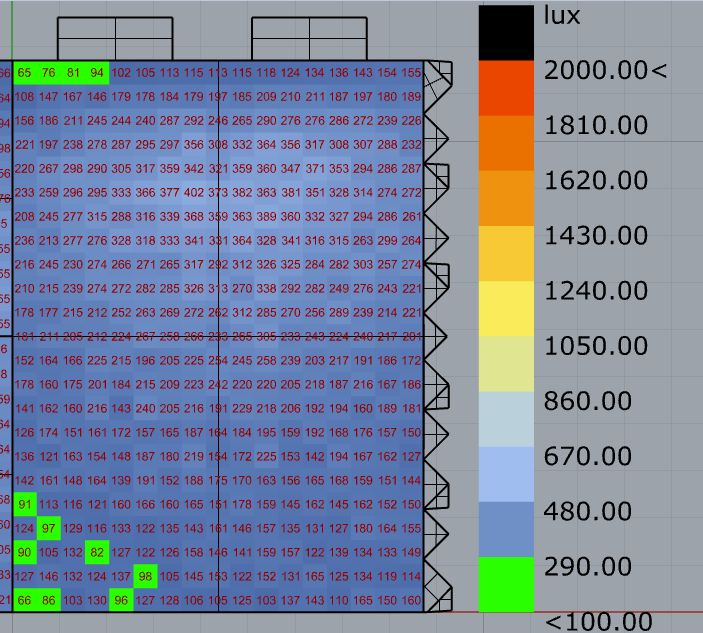
I did try mapping values on the grid, I am getting the green-colored grids only in the range <100.
As I mentioned, the viz in the legend shows green colored grids are between <290 - <100 lux range but the green grid values show <100 lux values only.
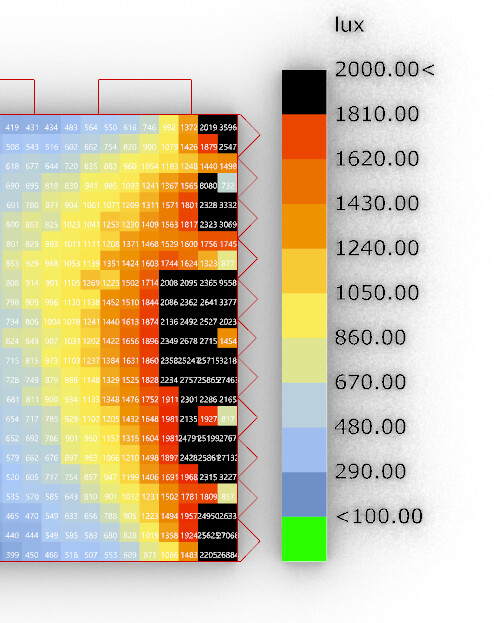
@m.gilvez , if we do bake the results and move the values up to match the legend, then the values >2000 lux marked in black will also not fall in the color range showed in the legend rite.
As per this example, if we do what you suggest, then the black grids as per the legend will fall in the range of >1800 - >2000 lux. But the results will show black grids only >2000 lux.
See the sample below