Hello,
I’m new to thermal comfort modeling, and had a question about the relationship between PMV and TCP. I read this post which was helpful, but looking at my results, I’m still not sure I understand.
I’m trying to study a waiting area along a southwest facade in Wisconsin. I’m testing out different exterior shading devices to understand the impact on thermal comfort.
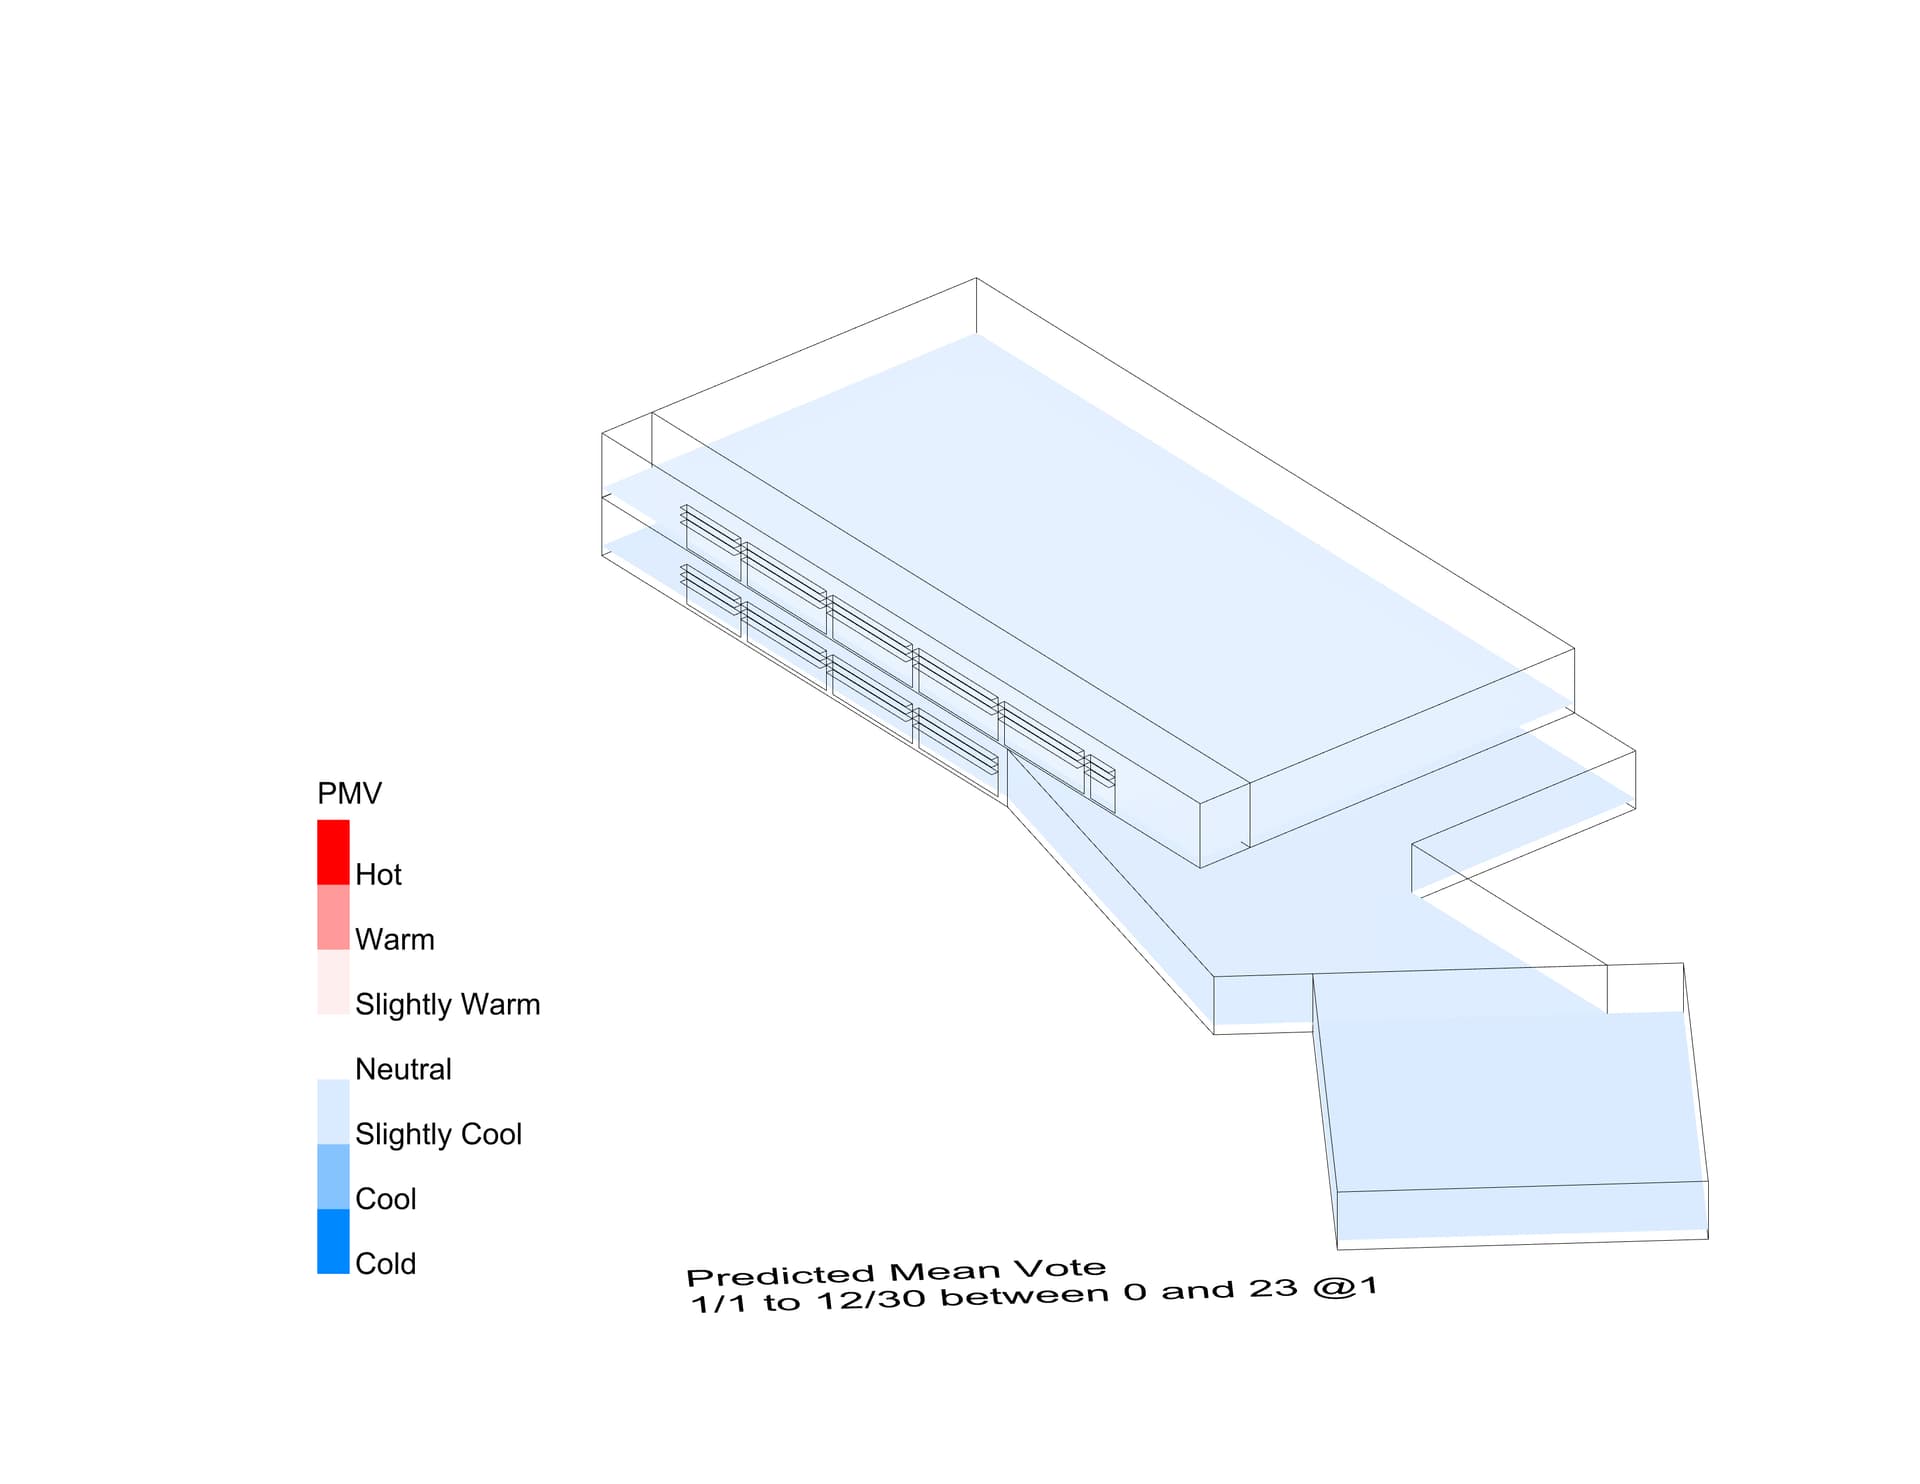
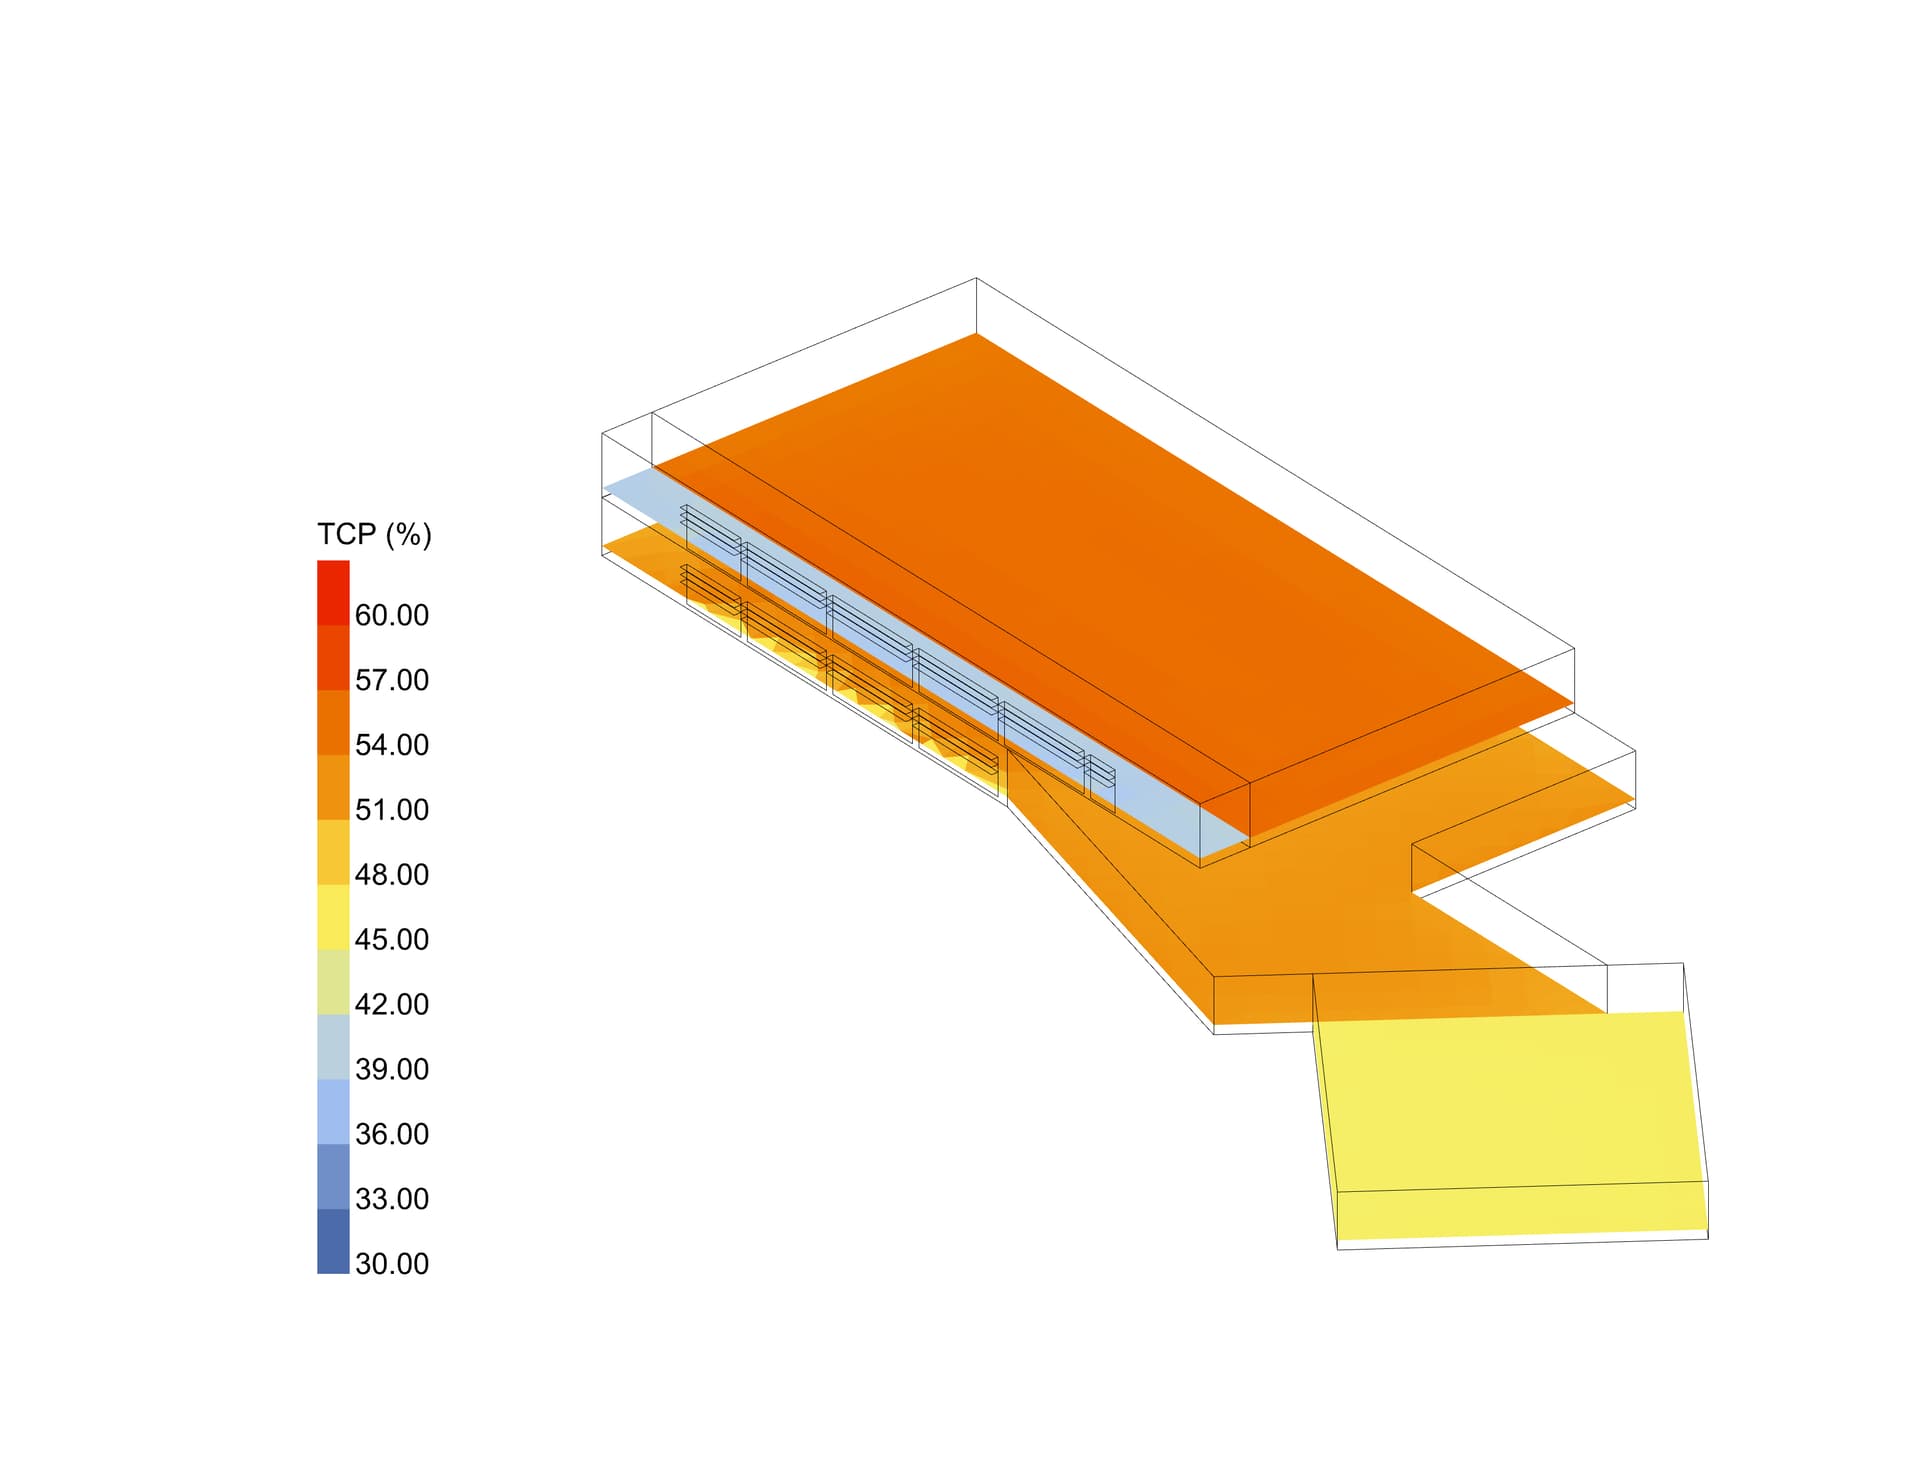
When I run an annual PMV, I get a light blue grid (see image), which I think corresponds to “slightly cool” or at or below -1 PMV. In translating to PPD, it seems like that would correspond to around 20% of occupants dissatisfied, but the TCP shows ~36%+ (meaning 64% dissatisfied). I assume I am interpreting these incorrectly, but could someone explain it to me?
Thank you!
Kera