Hello friends,
I’m looking for ways to replace or blend the values of yearly data sets (selectively)
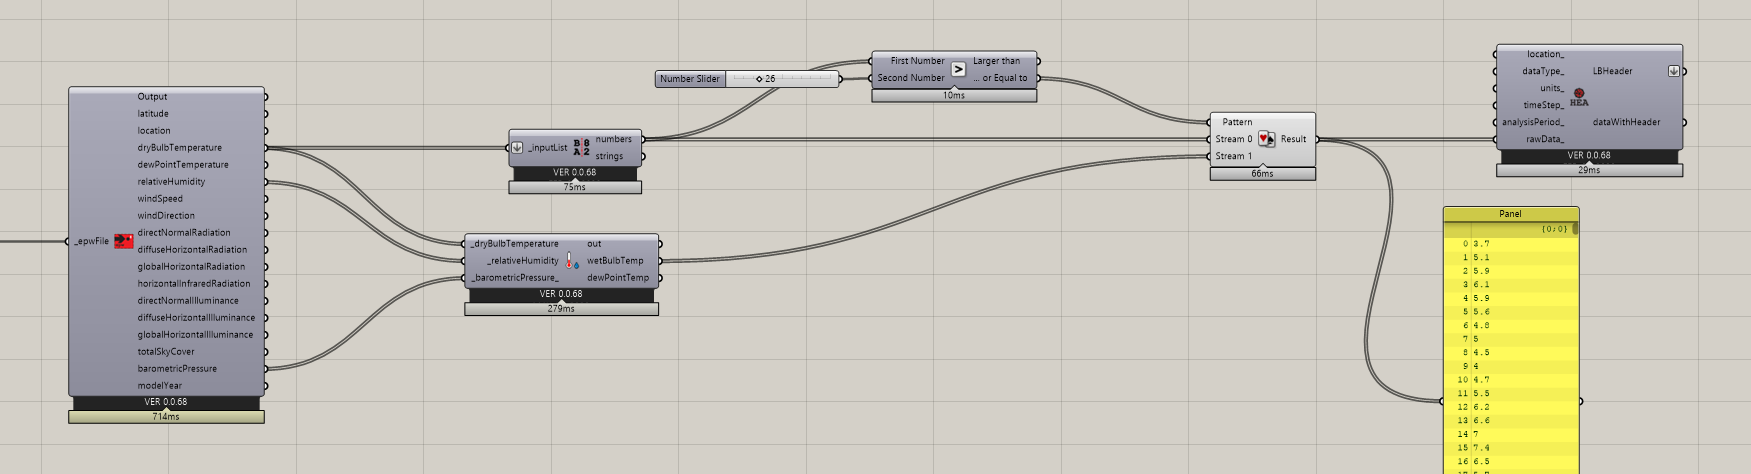
Set 1 contains Dry Bulb Temperatures directly from EPW.
Set 2 contains Wet Bulb Temperatures, the result of the wetbulb component from EPW values.
I want the resulting set to be a DBT, but replaced with WBT values whenever x threshold is triggered. For example, when DBT=/> 26C°, replace that index with the same index from the WBT. It could even be a % of the WBT since I can’t assume it’s 100% effective.
How is this logic translated into gh? Are there any examples of this?
Thanks!