Hi,
I need to plot my residuals in log form.
QUESTION 1:
I read around and it seems that BF still doesn’t have the possibility to plot it within BF.
I tried to adding a “ln” component to the values of the residuals, but it it gave me error, perhaps also because I can only collect the last iteration values, not all the iterations ones within BF.
However the “normal” values creat the full plot of all iterations, so is it possible to extract all those values in an easier way than through the file of the case, through BF? Then I could do the log in excel…
I therefore followed the steps expained on this article:
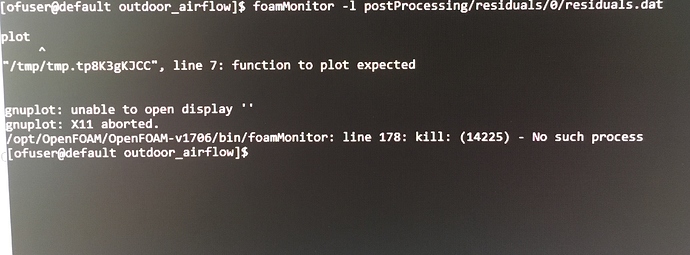
which seems to work until I get to the visualisation: it seems to need “Gnuplot”, I installed the latest version 5.2.4 but it gives me this error:
" [ofuser@default outdoor_airflow]$ foamMonitor -l postProcessing/residuals/0/residuals.dat
plot
^
"/tmp/tmp.tp8K3gKJCC", line 7: function to plot expected
gnuplot: unable to open display ‘’
gnuplot: X11 aborted."
Please how can I visualise the results with Gnu?
Is it a problem of the version of Gnu (release June 2018) while OF is 1706? Alternatively please?
QUESTION 2:
What is the “residual control” default value in the “SteadyIncompress” component? And what is the residual control component for? If it’s to set the precision of the final resduals, then does the number of the iterations needs to be left empty, as BF will run until the set residuals will be obtained?
QUESTION 3:
I did tests with 600 iterations or less, they do work.
Now I tried 2000 iterations, and it’s the 3rd time that the simulation stops at 672nd iteration. Why is this happening please? Is this connected to the definition of my mesh, and therefore after 672 iterations I don’t get the convergence and therefore it stops? ANy other idea?
Thank you very much.
Viola
