Dear all,
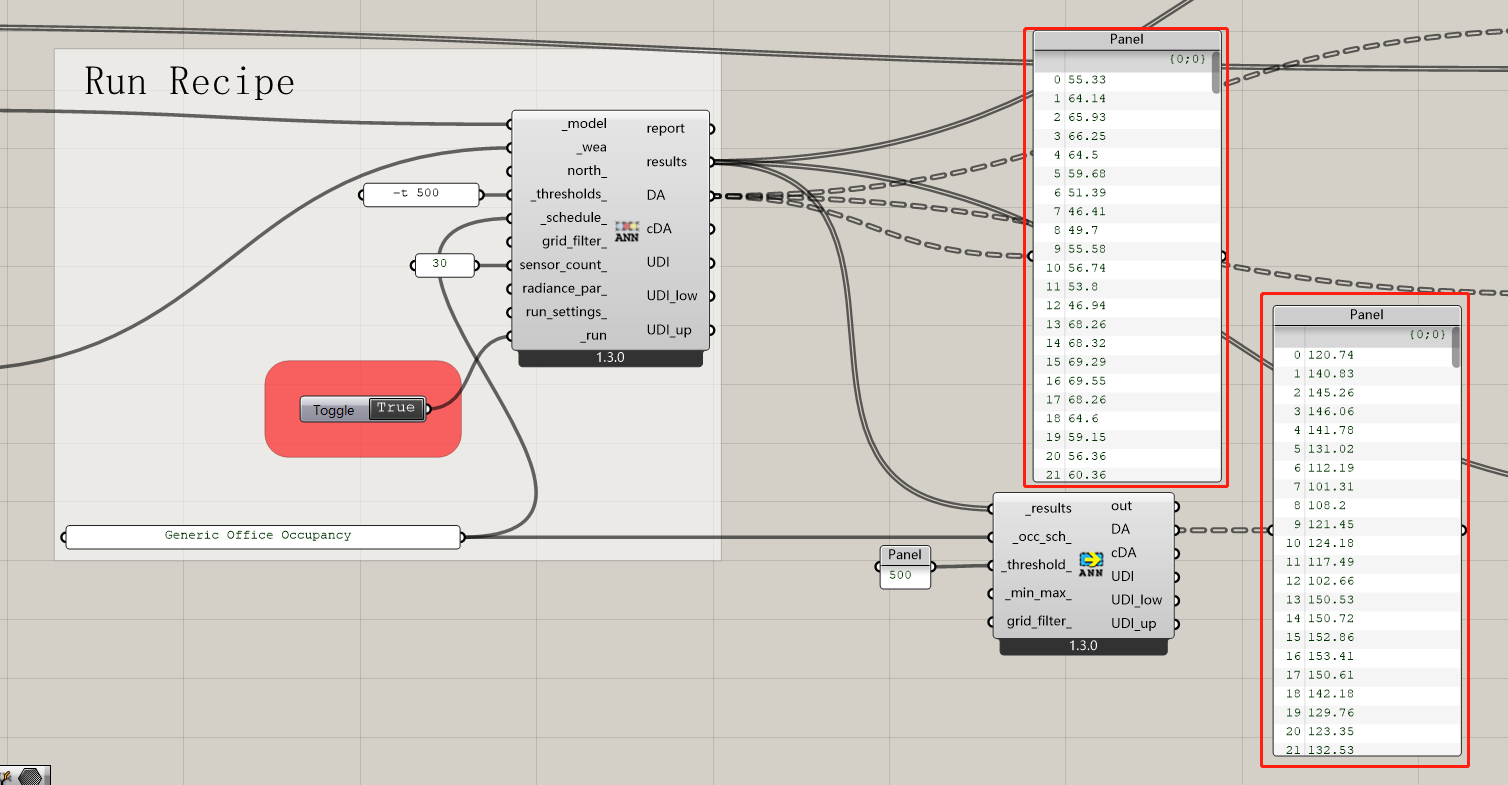
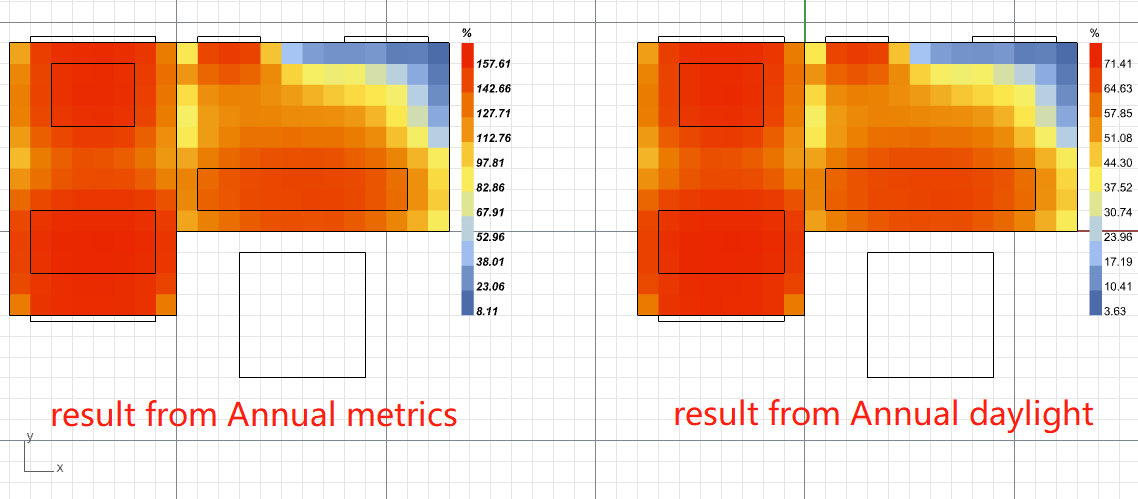
I am quite new to Ladybug tools. I am running a simulation using the sample model “annual_daylight.gh”(LBT 1.3.0). After simulating with the “AnnualDaylight” component, the results from the “AnnualDaylight`” component and the “AnnualMetrics” component are different. The DA results from “AnnualMetrics” component are even bigger than 100%.
They have the same color of each grid, but different legend numbers.
Maybe these two components have different methods when calculating the occupied time?
I think the total occupied time is different. Maybe you are right, and these two components have different methods when calculating the occupied time.
I don’t know why there is a difference since they have the same schedule. Is there something I’ve overlooked?
Thanks for finding and reporting this issue, @S_hertz and @Yang .
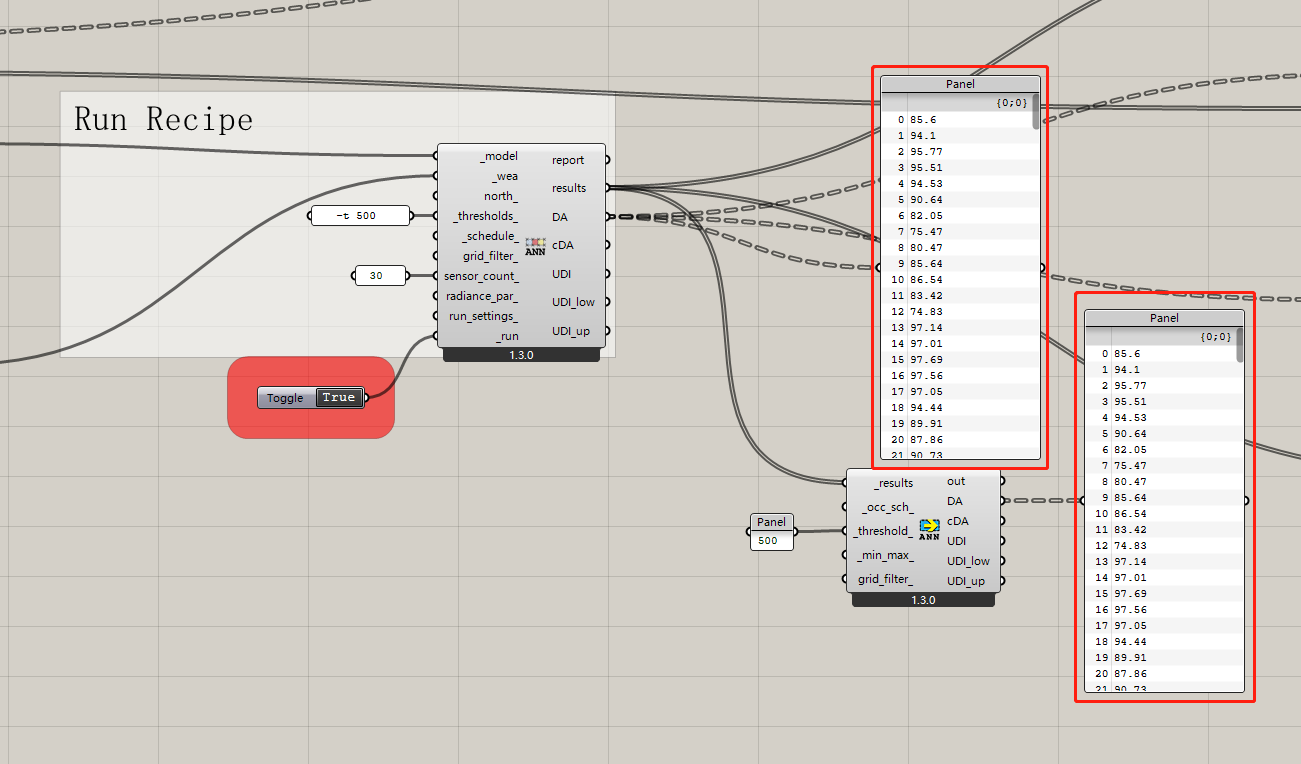
This is a bug in the way the Annual Metrics component interprets the fractional values of the “Generic Office Occupancy” schedule since the two components use the same methods under the hood and so they should be producing the same results. The only difference was in how fractional schedules were interpreted, which was causing the Annual Metrics component to be wrong. I just pushed a fix to the development version of the plugin:
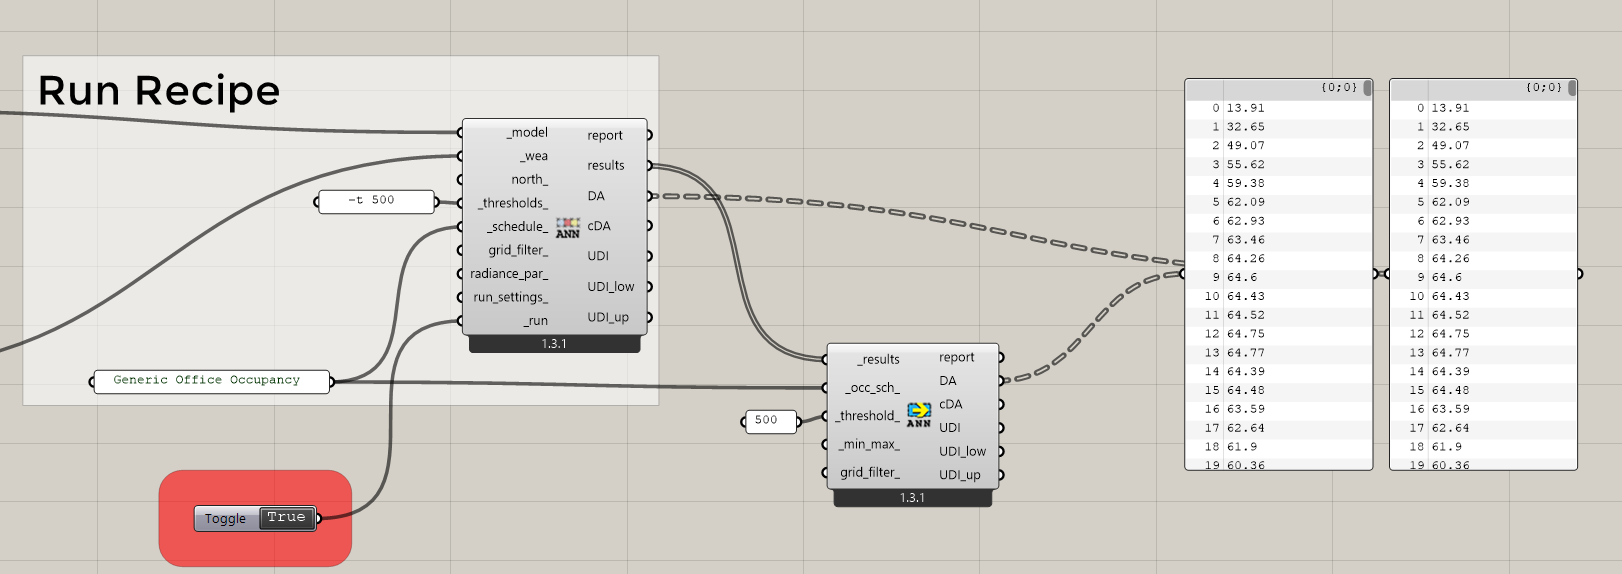
… and the fix will be available via the LB Versioner in an hour or so. Once upgraded, you’ll find that the results match:
If you don’t want to upgrade to the development version, you can also just convert all fractional schedules into schedules of 0’s and 1’s and that will also address the issue.