Hello,
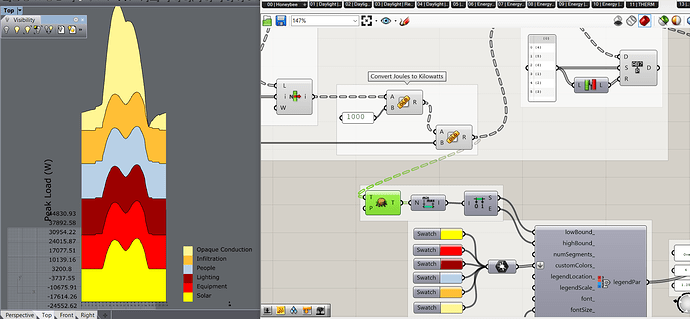
I have been seeking a solution, but I cannot seem to get the LB Linechart Component to scale within the domain of the values I have specified. Using the HVAC Sizing Peak Values example from Hydra, I am inputting my own geometry and cannot get the graphics of the chart to scale to the grid of values.
I have tried deconstructing the domain of the design day values to no avail. Is there a trick to this component? I am getting many negative values. My domain is roughly -2000 to 4000 kW. This seems rather off.
Thank you for your response!
err_lineChart.gh (652.9 KB)