Is that how it is supposed to behave? Is that supposed to output some sort of daily average value when you use the Analysis Period in that manner? Not sure how to interpret these results, or if its just some bug when the start and end hours are equal? I get some odd results when I move the start time in this case too?
If someone could explain the ‘right’ way to use these components I would appreciate it! Not sure where I’m going wrong here? Or if there is an easier way to output a representative weekly profile data set, that’s all I’m really after in this case.
Hi @edpmay ,
Sounds messy but it is not
I suggest to connect a panel to the dates output of the analysisPeriod component. There you’ll see the days and hours taken.
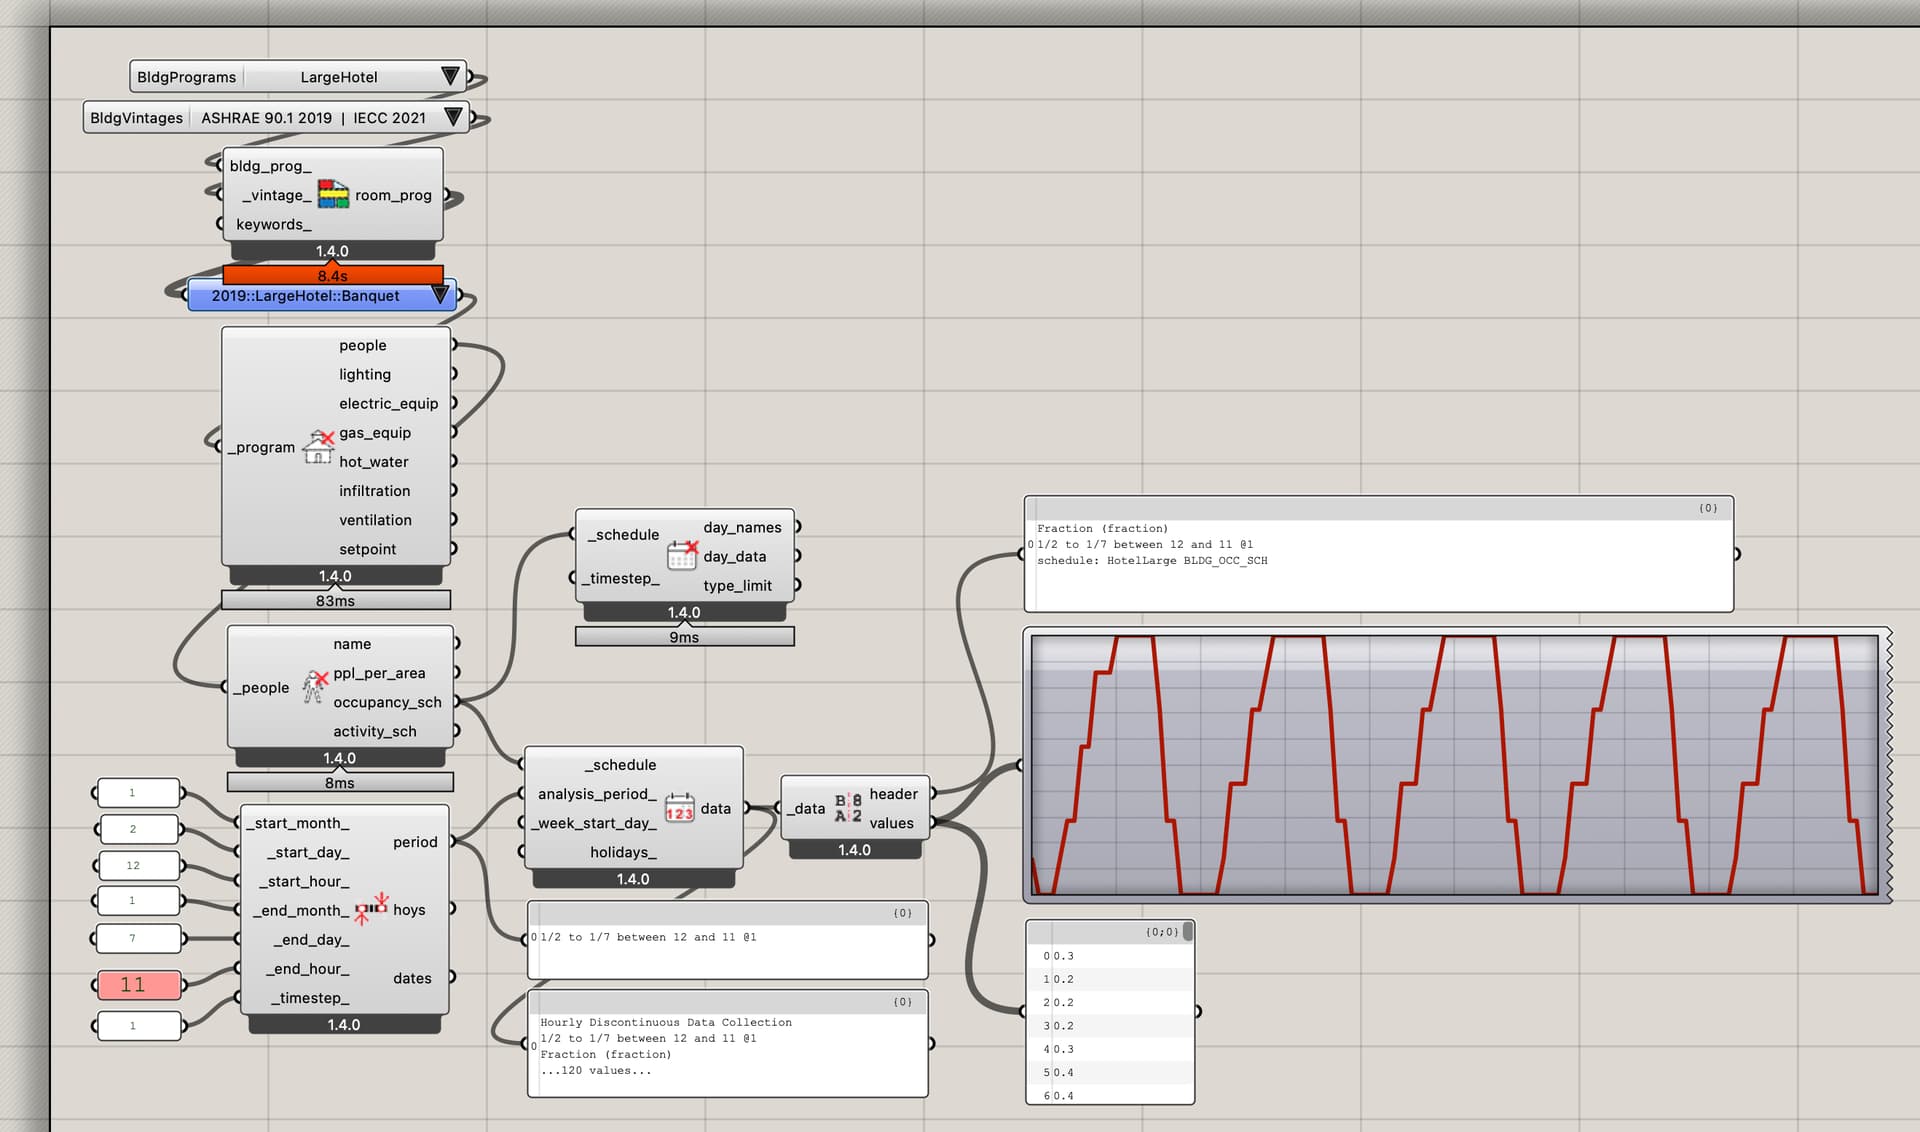
Your first case takes from noon of the first day to 11 am of the following. There you have 12 hours for the first day 24 hrs for the following 4 days and again 12 hours for the last. Total 120 hours.
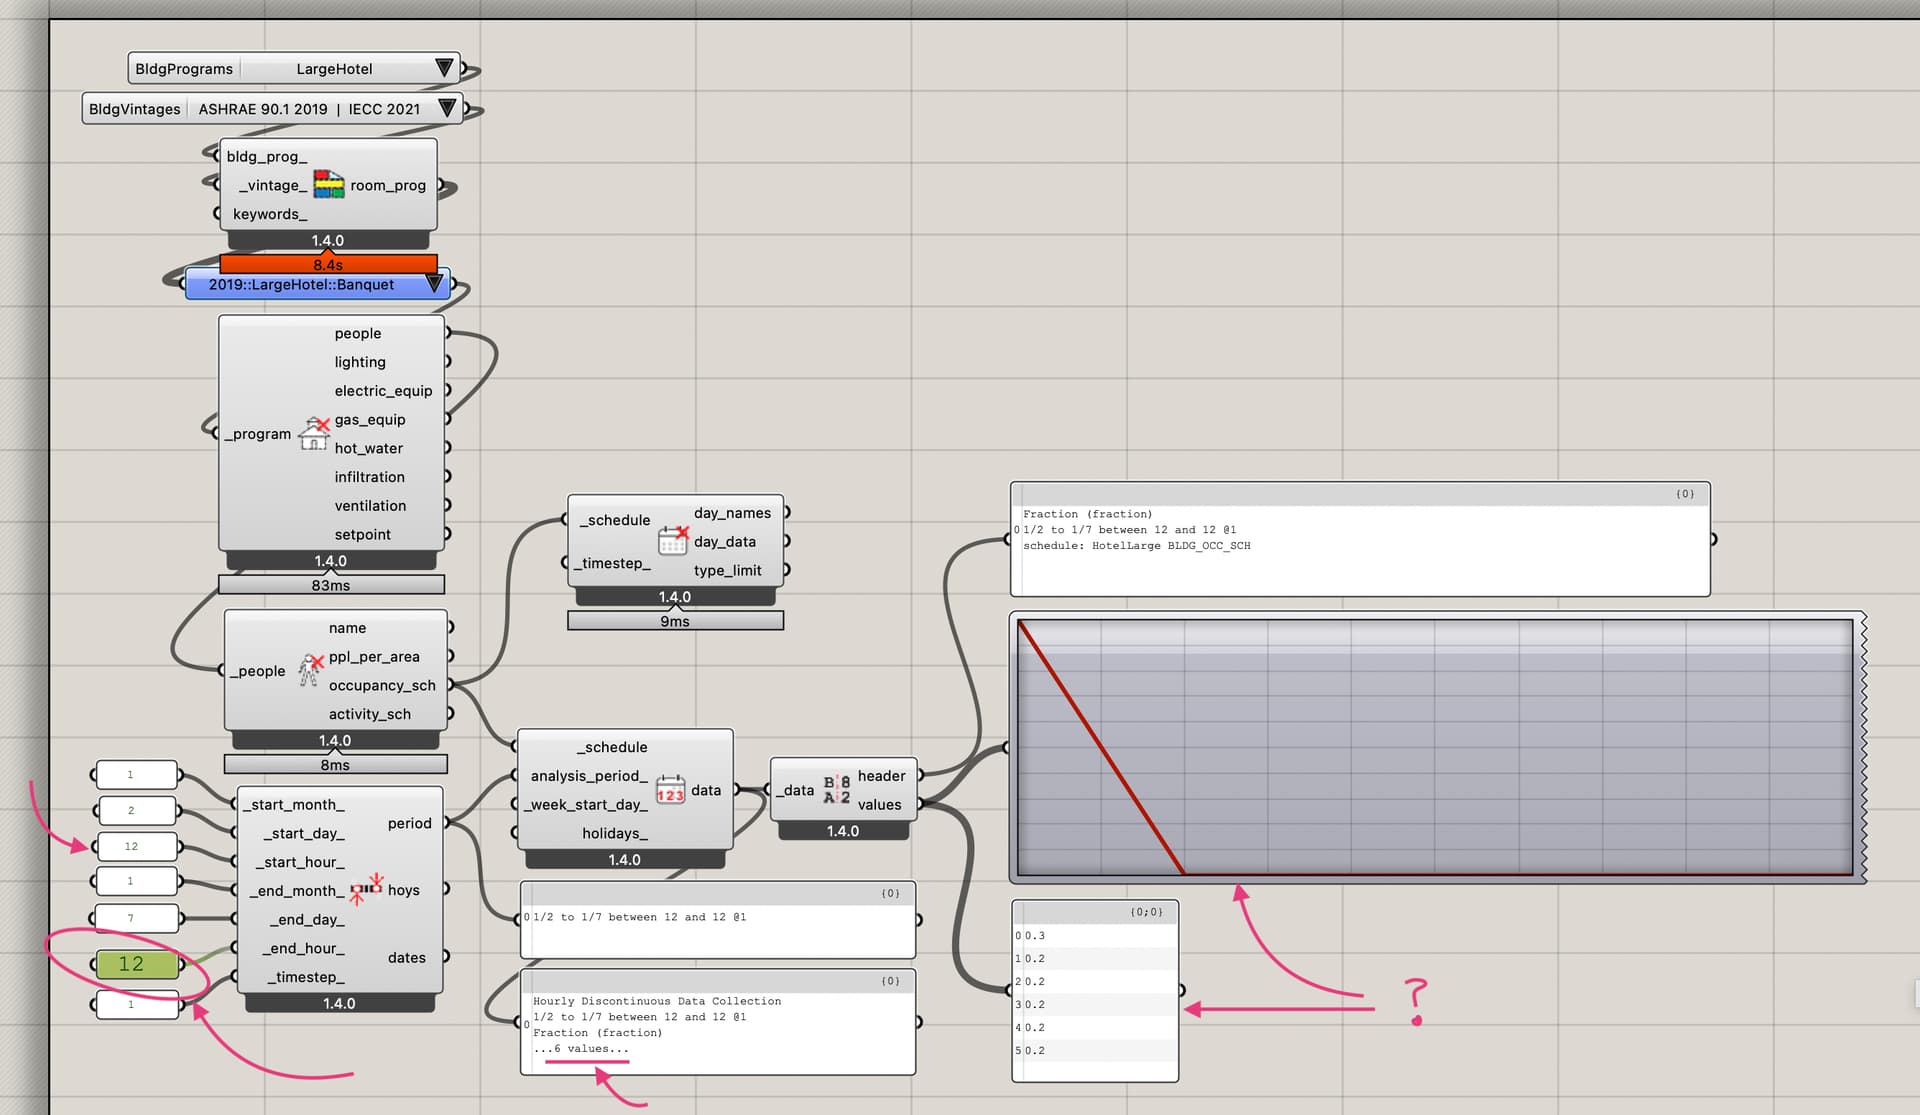
Your second case takes only one hour for each day. Then you have only 6 values (at noon).
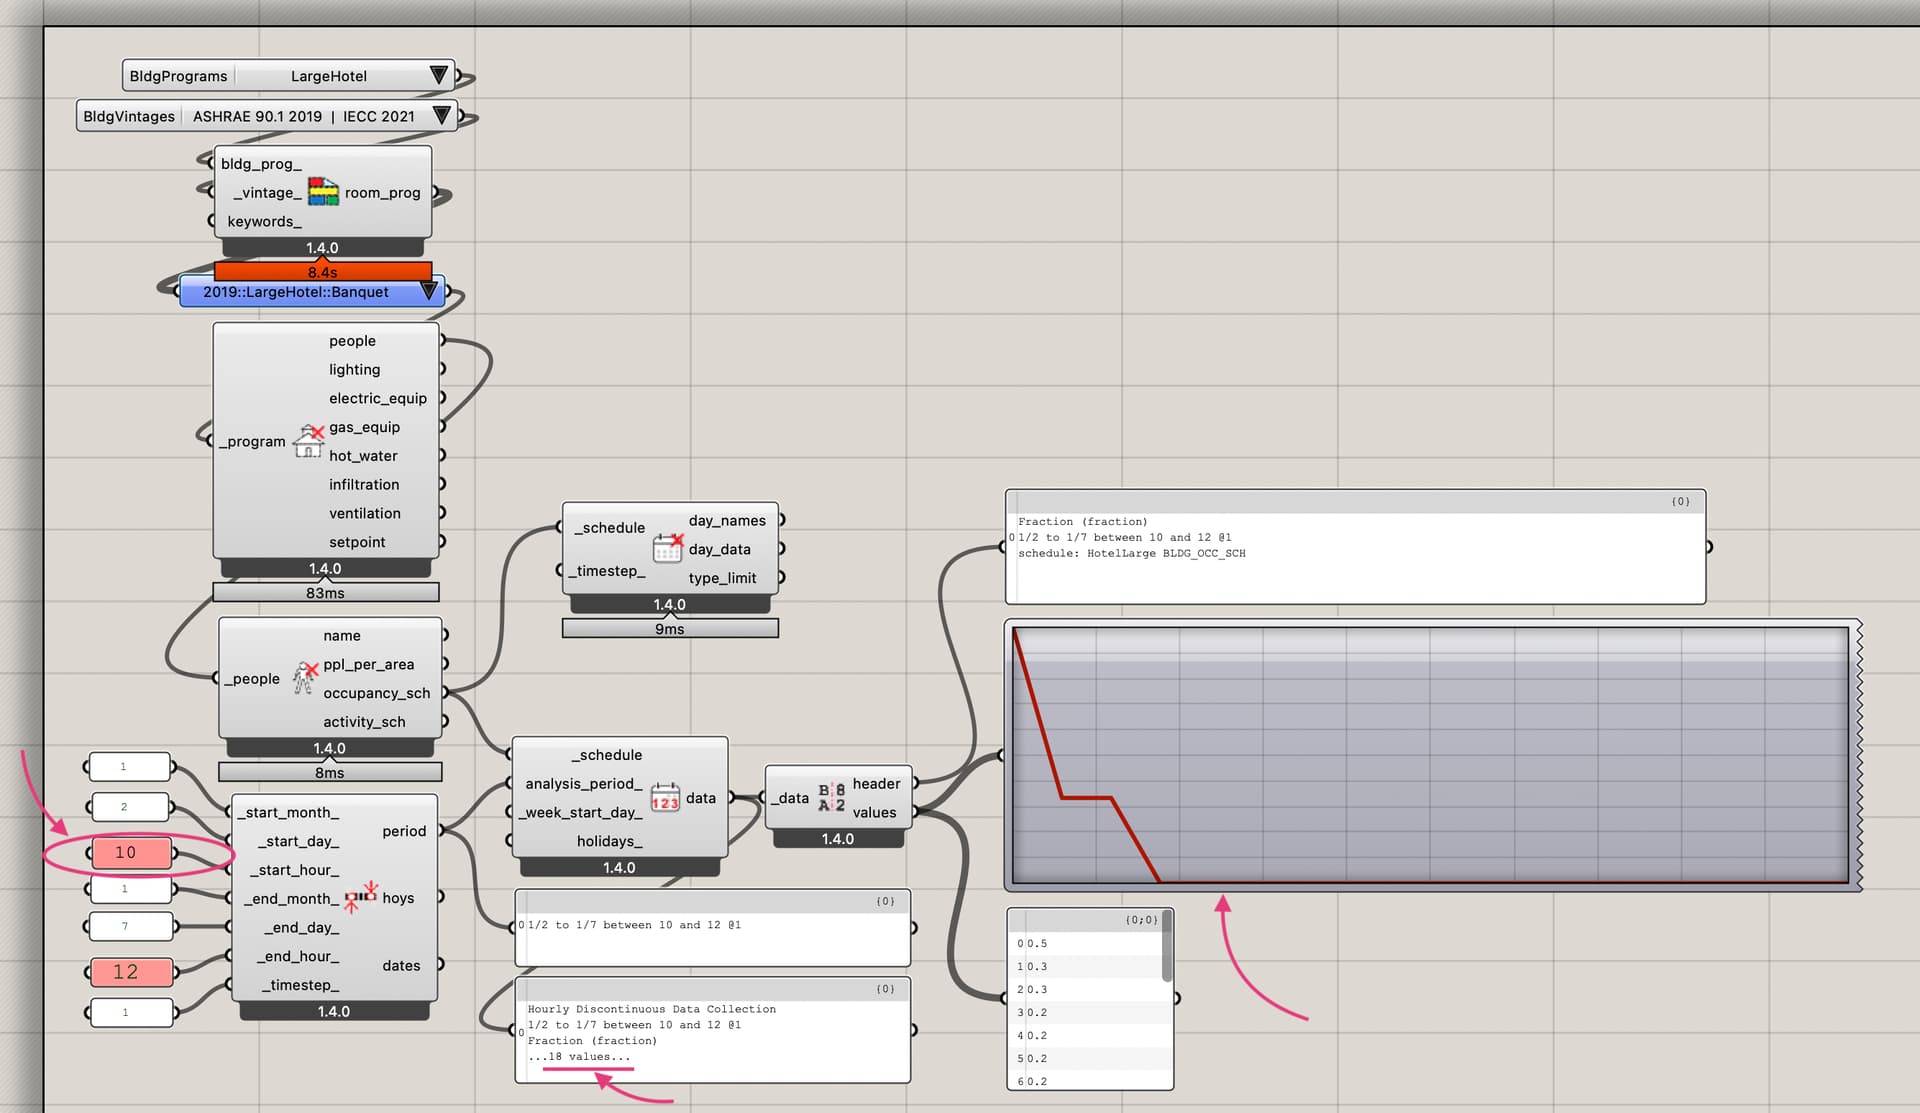
The third case is taking 3 hours each day, then you have 18 values. The first 4 values are different and then all other 14 are equal to the 4th. That’s why you see what you see.
Hope is clearer now. What is not clear to me is what are the hours that you need …
I think I just totally misunderstood that component. I thought that the LB Analysis Period inputs meant like Month/Day/Hour of the start time, and then Month/Day/Hour of the end time.
So that something like this:
It is a bit tricky. The component has a bit of “intelligence” in it.
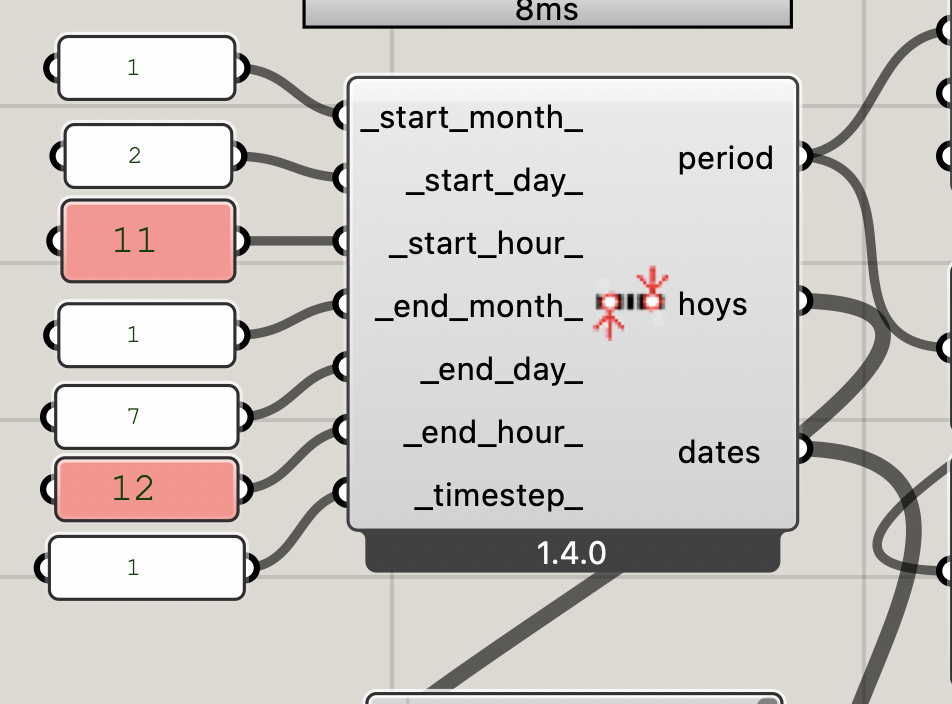
When the start hour is bigger than the end hour it assumes that you want all 24 hours for all days. except the first and last.
When the start hour is smaller than the end hour, it takes for ALL days just the span of hours between them. Your last image will give you 12 hours, 2 hours daily.
Hope @chris can confirm, just to be sure.
Yes, that’s correct, @AbrahamYezioro . This is the way that analysis periods work across all of Ladybug Tools since it’s more common for someone to say something like “I only want to study the daytime occupied hours” rather than “I want to study both daytime and nighttime hours except for the first few hours on the first day and the last few hours on the last day.”
If you really need the latter, you are better off deconstructing the data collection and using native Grasshopper List components to shave off the first few and last few hours.