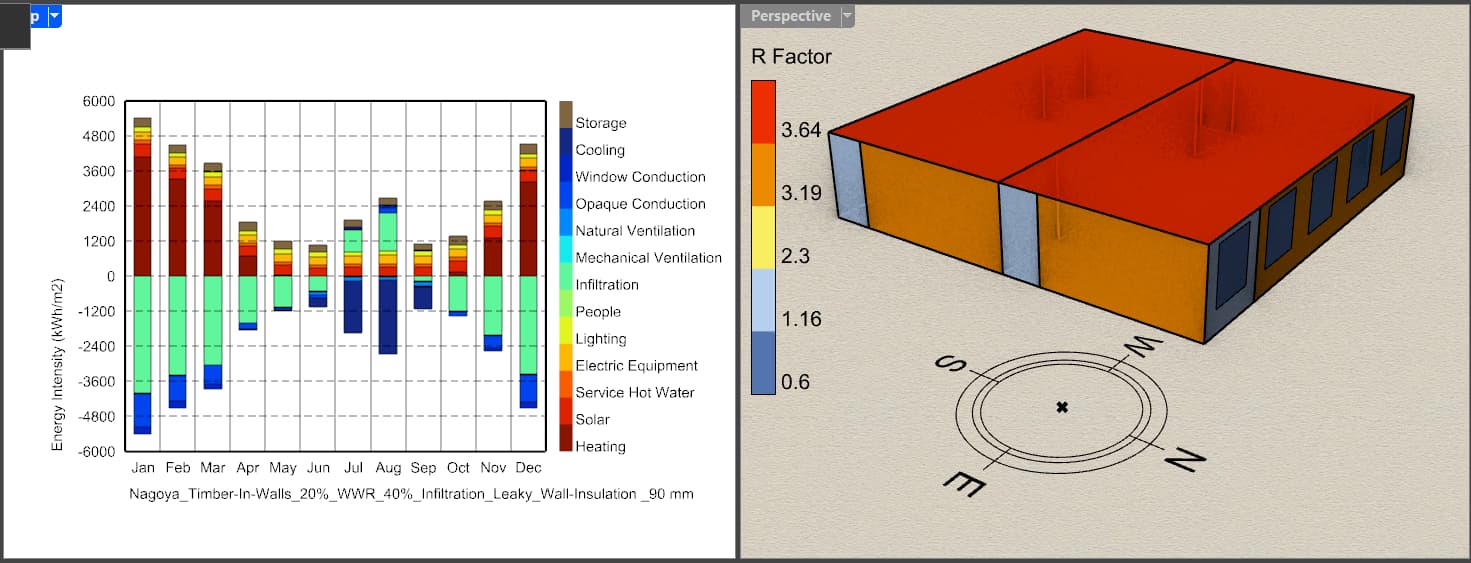
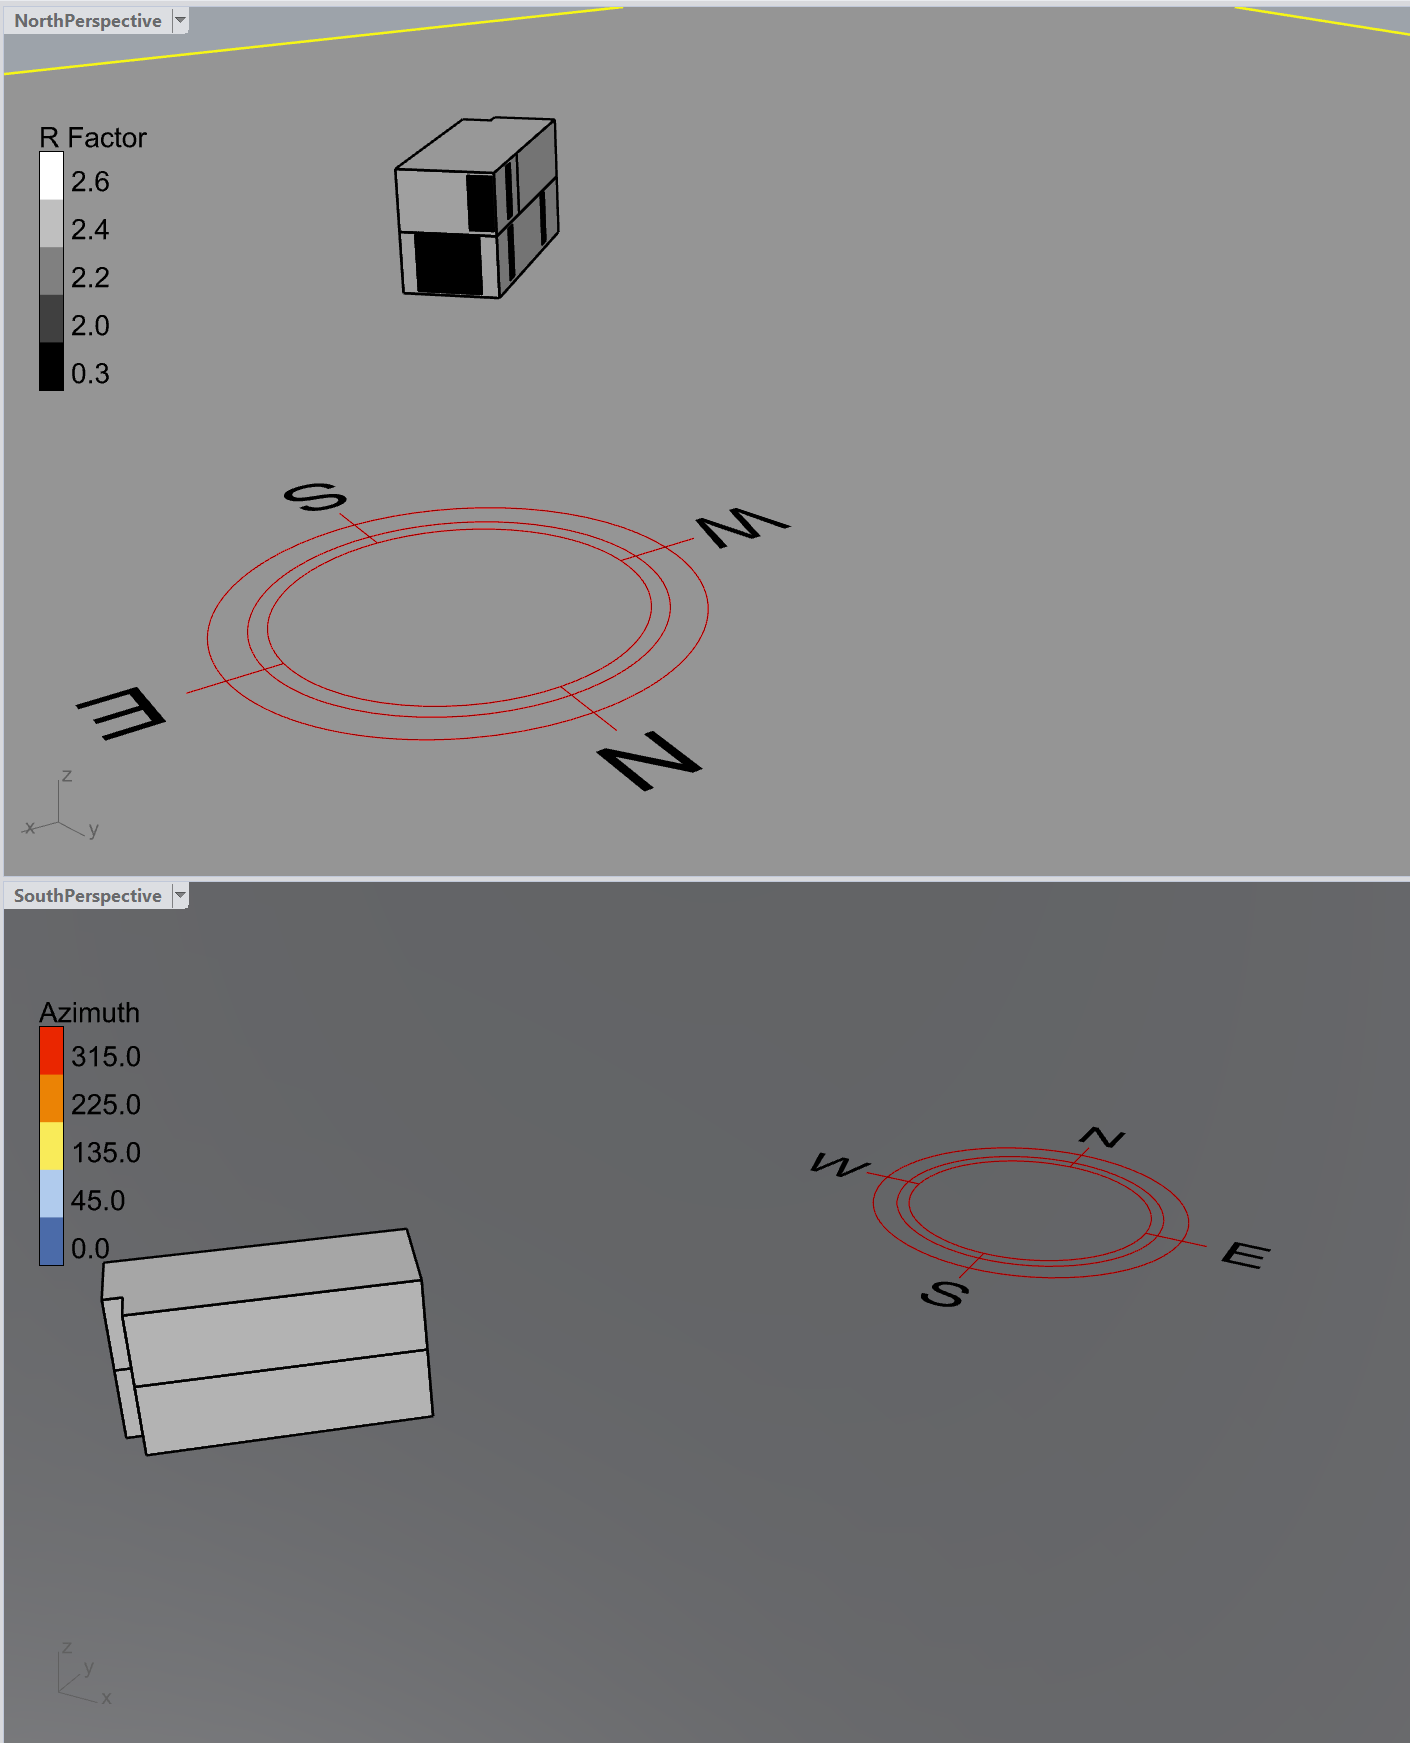
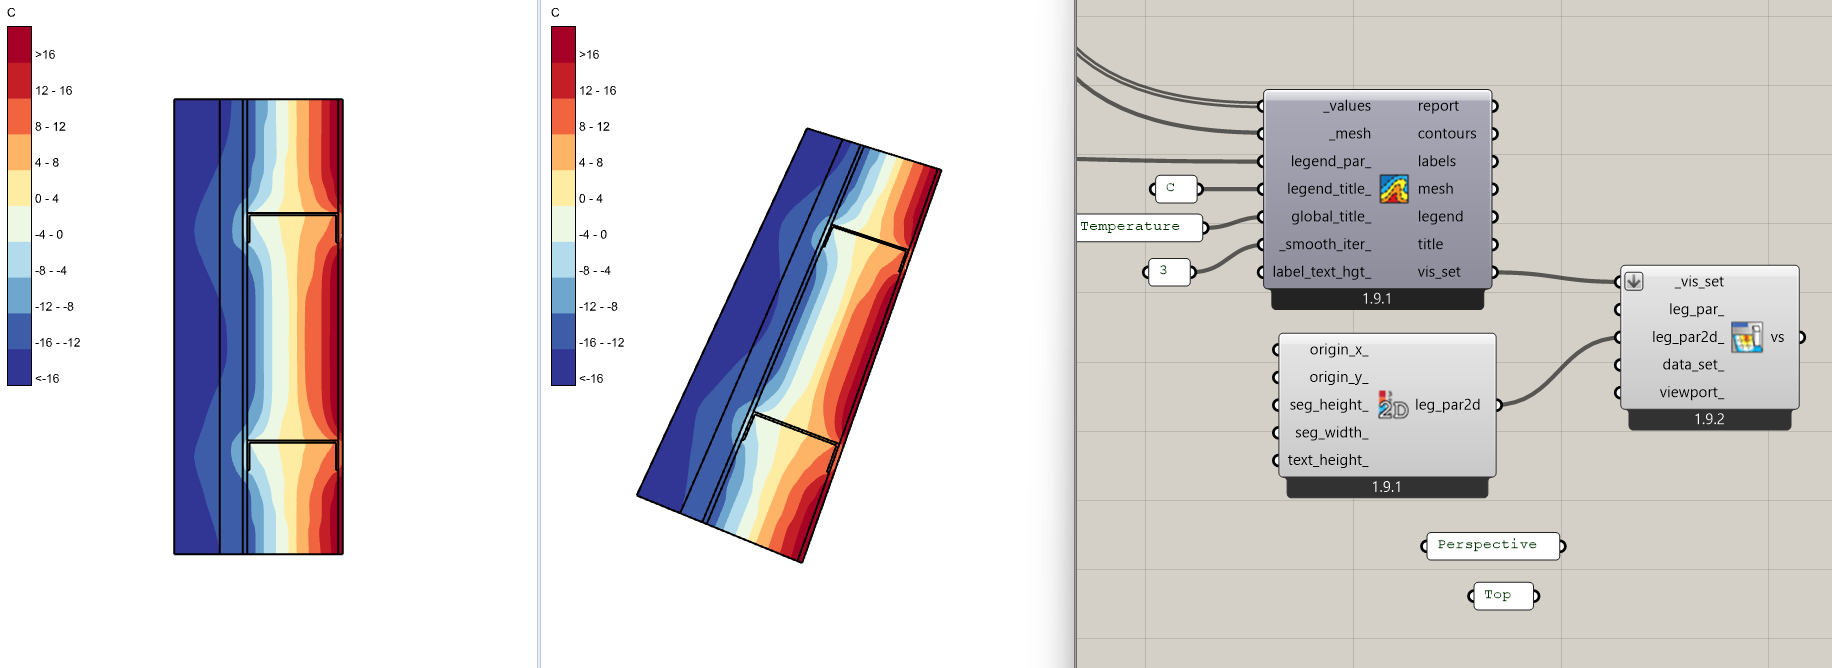
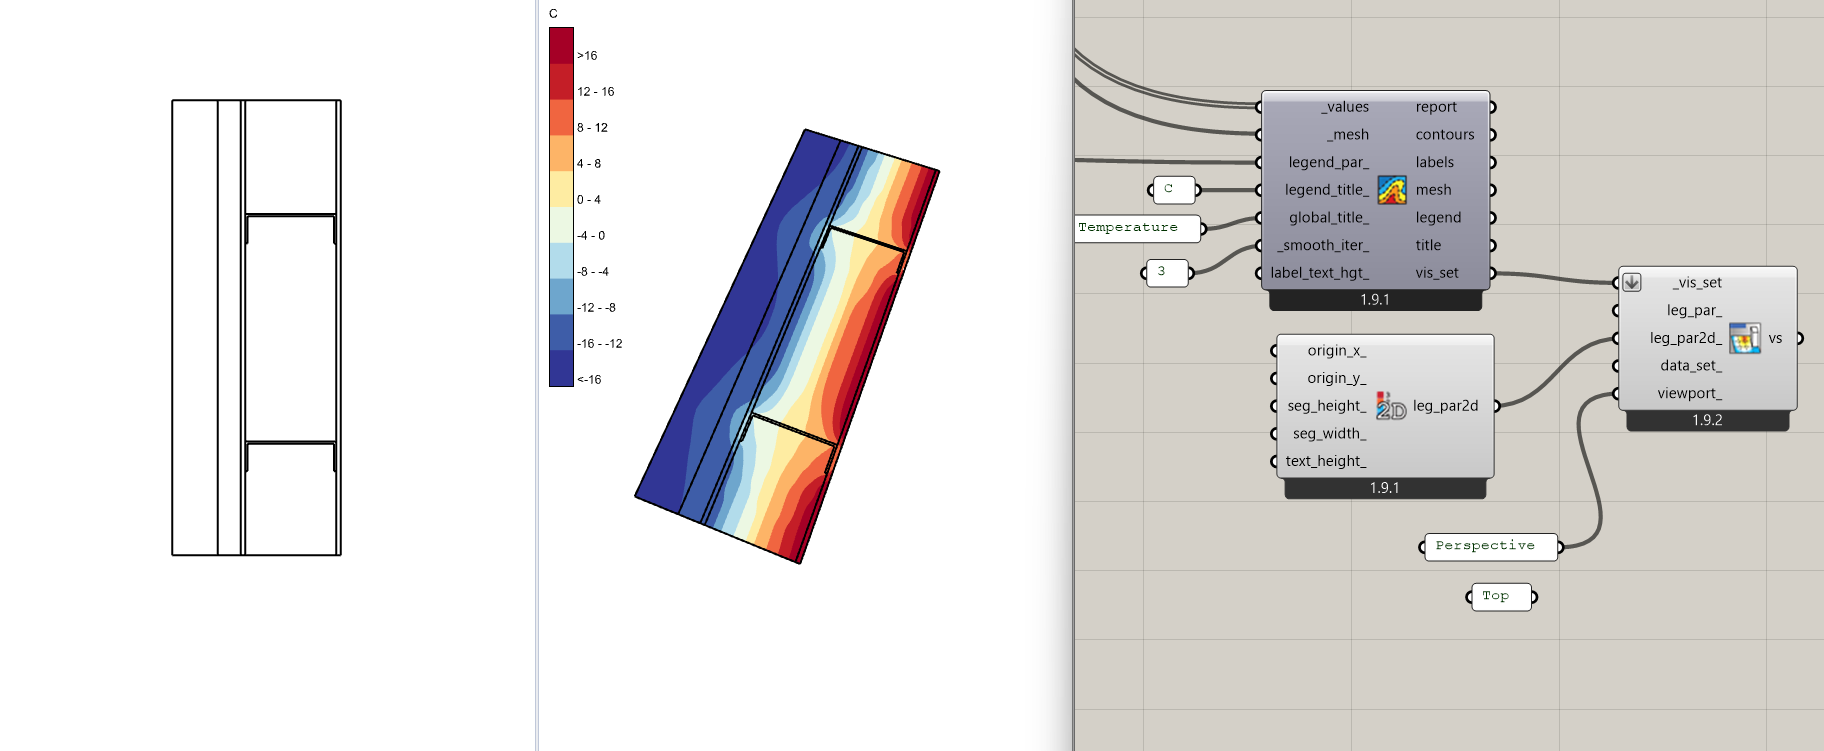
The goal is to capture at least 2 graphs with parallel to the screen annotation using the Fly component, which your viewport specification for Visualisation Sets manages beautifully. I would like to have the same control over the 2Dtext component. In the following two graphs, I would like the perspective to show the R-values for the (simplistic) model, but I would like to add the Heating and Cooling EUi and total via 2DText above the Energy Balance Graph. At present, such annotation appears in both windows!
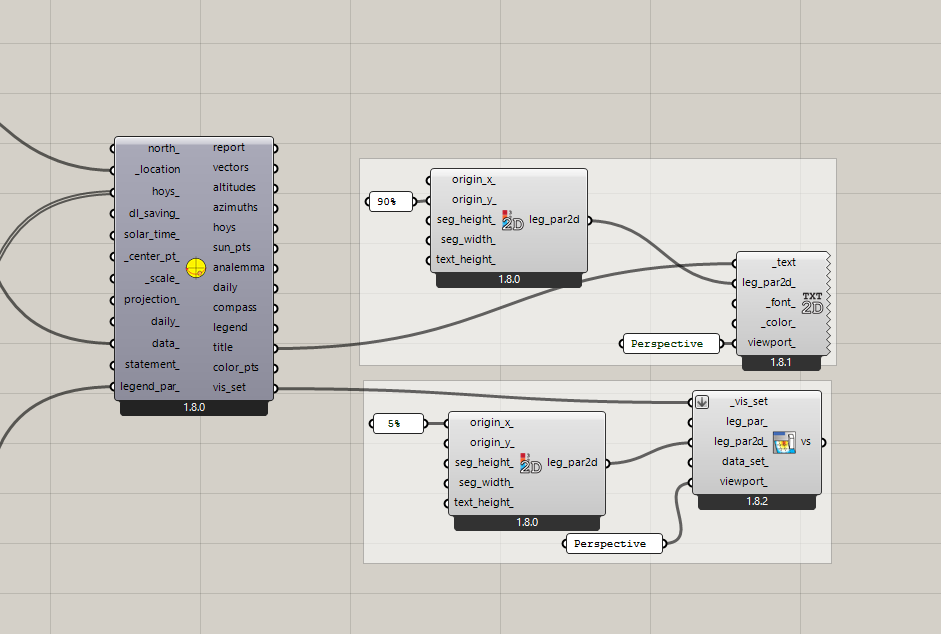
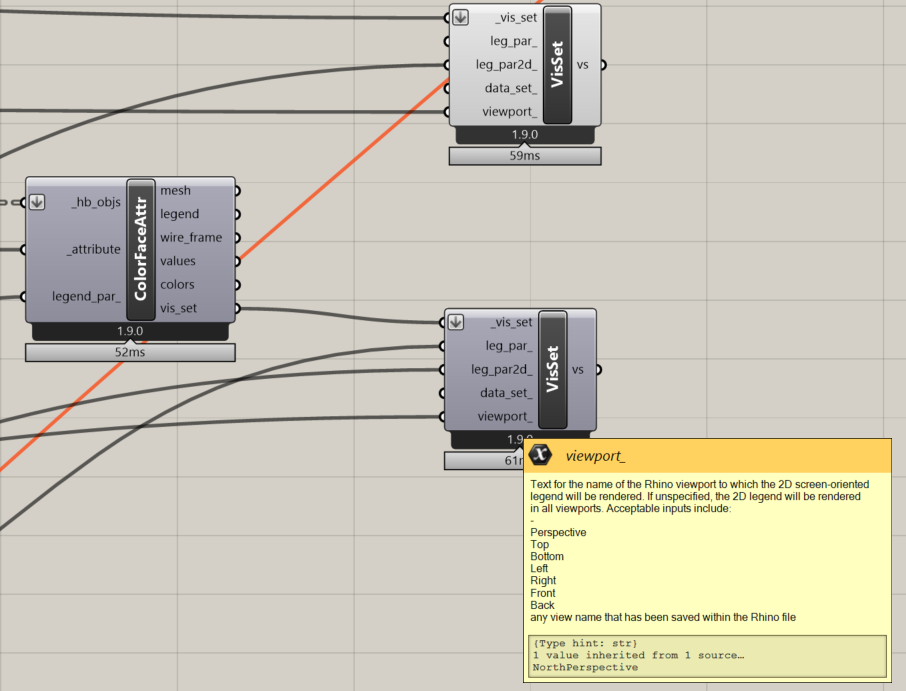
This is a great suggestion and it only makes sense to have it now that we also have the viewport_ option on the Visualization Set component. I just added it here:
Now you can limit the 2D text to be in a specific viewport:
I make use of this enhancement all the time. Thanks. Really helpful.
I do have a follow-on question, resulting from my pushing things further. Partly this is because I am running a FLY exercise accessing the sql files from a study done using Legacy LBT capturing 256 images from 64 variations. I am not really wanting to individually view each file and render the properties.
NOTE: regenerating the Load Balance was amazing, even though it took some searching of the RDD file to identify “Surface Average Face Conduction Heat Transfer Energy” as the variable that I needed to access in the original E+9.1 files to feed into “face energy flow” input to the component. It is amazing to be able to reconstruct the graphics with far more graphic control, even though the importing of the .osm and ,xml models does not fully recover all the original opaque surface R-values.
THE ISSUE:
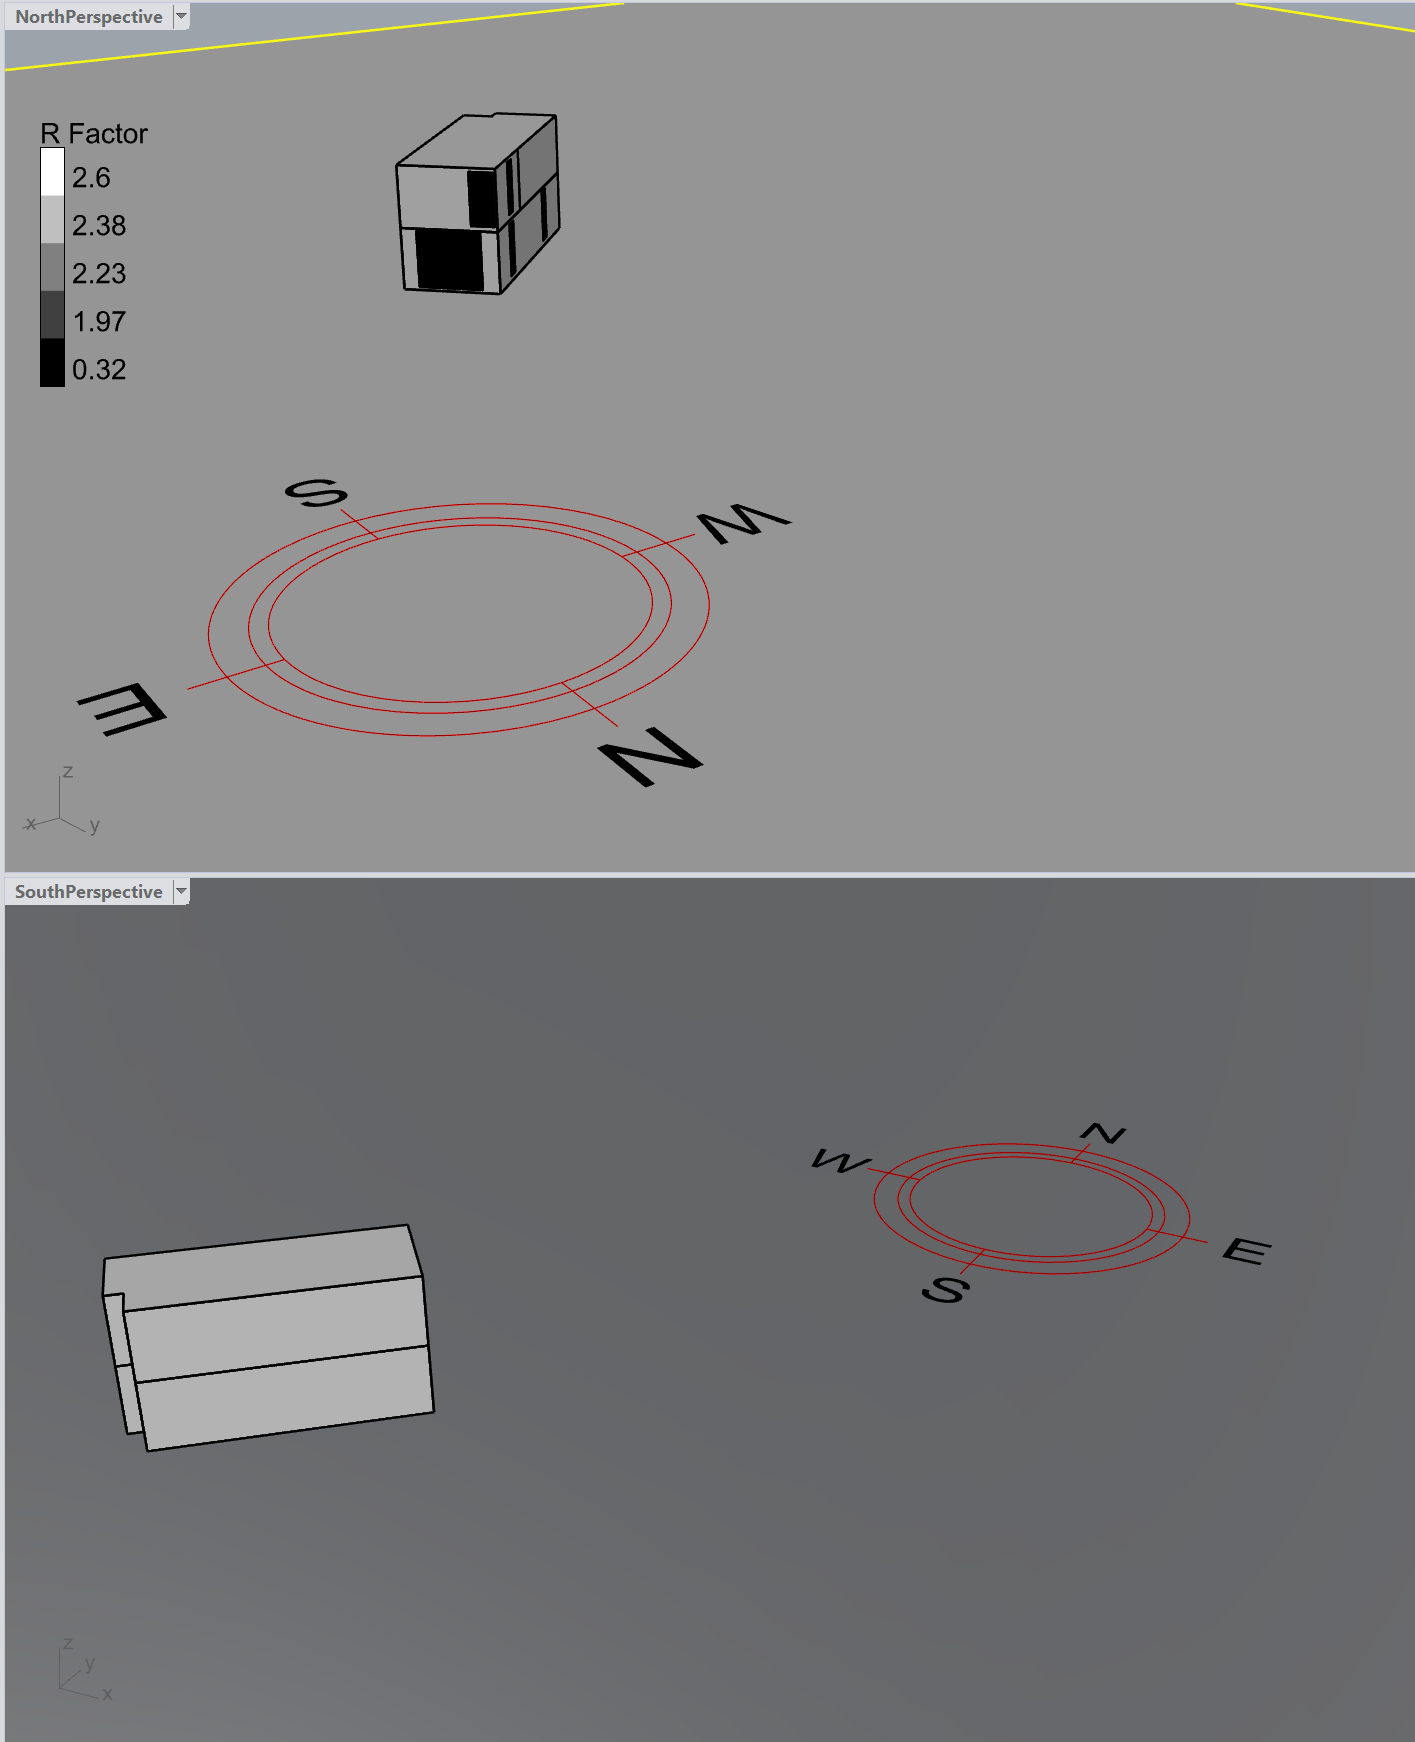
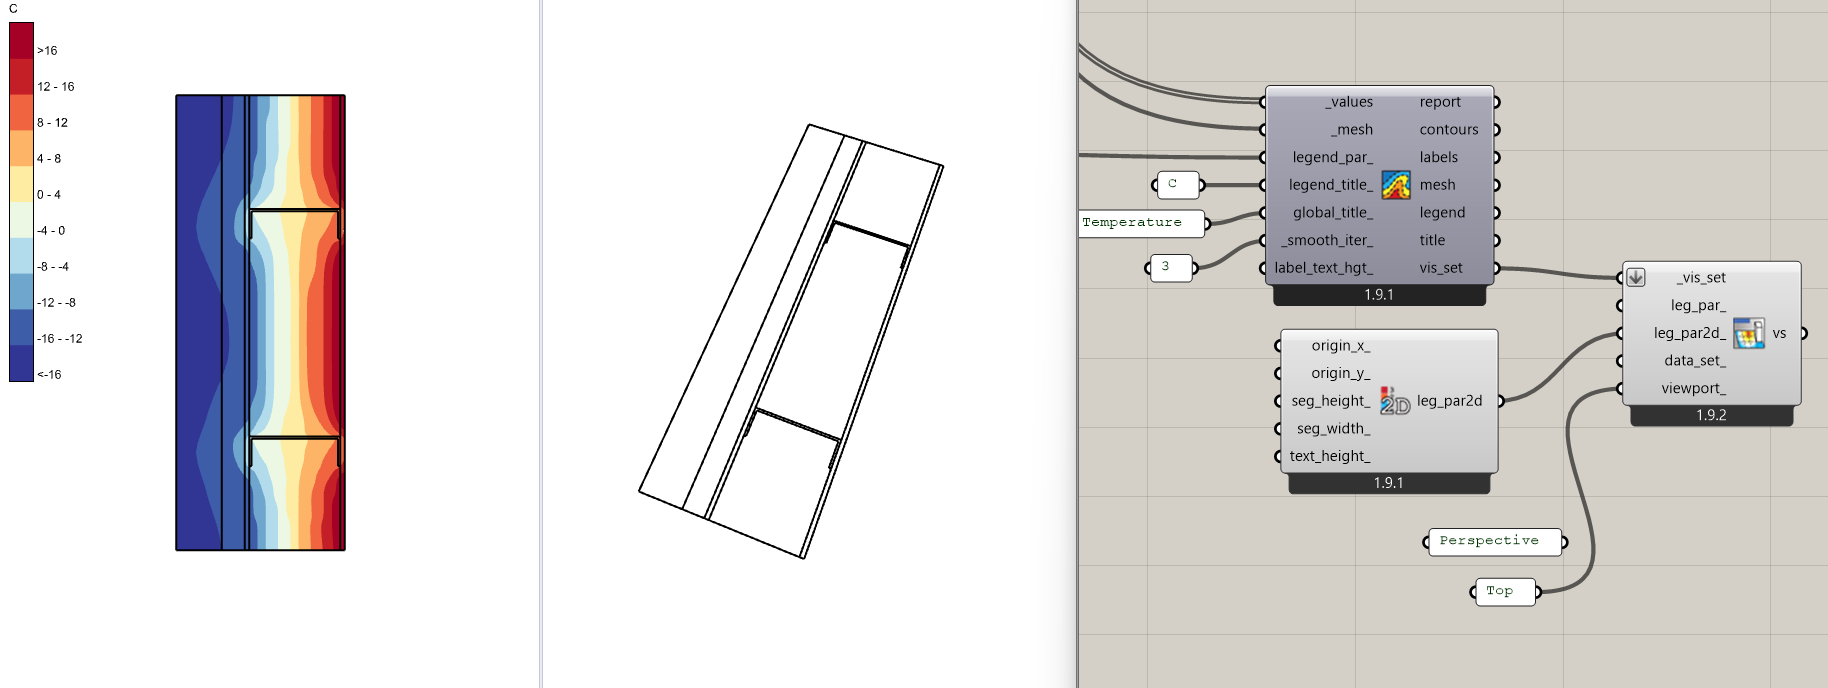
I am looking to have two named viewports with two different representations of the building. I can set the legends to turn on / off in the different windows, but the shading of the surfaces of the HB model appears in both windows even when the viewport_ input is carefully specified.
Sorry that I missed seeing this back in September (I was still getting adjusted to becoming a dad at that point).
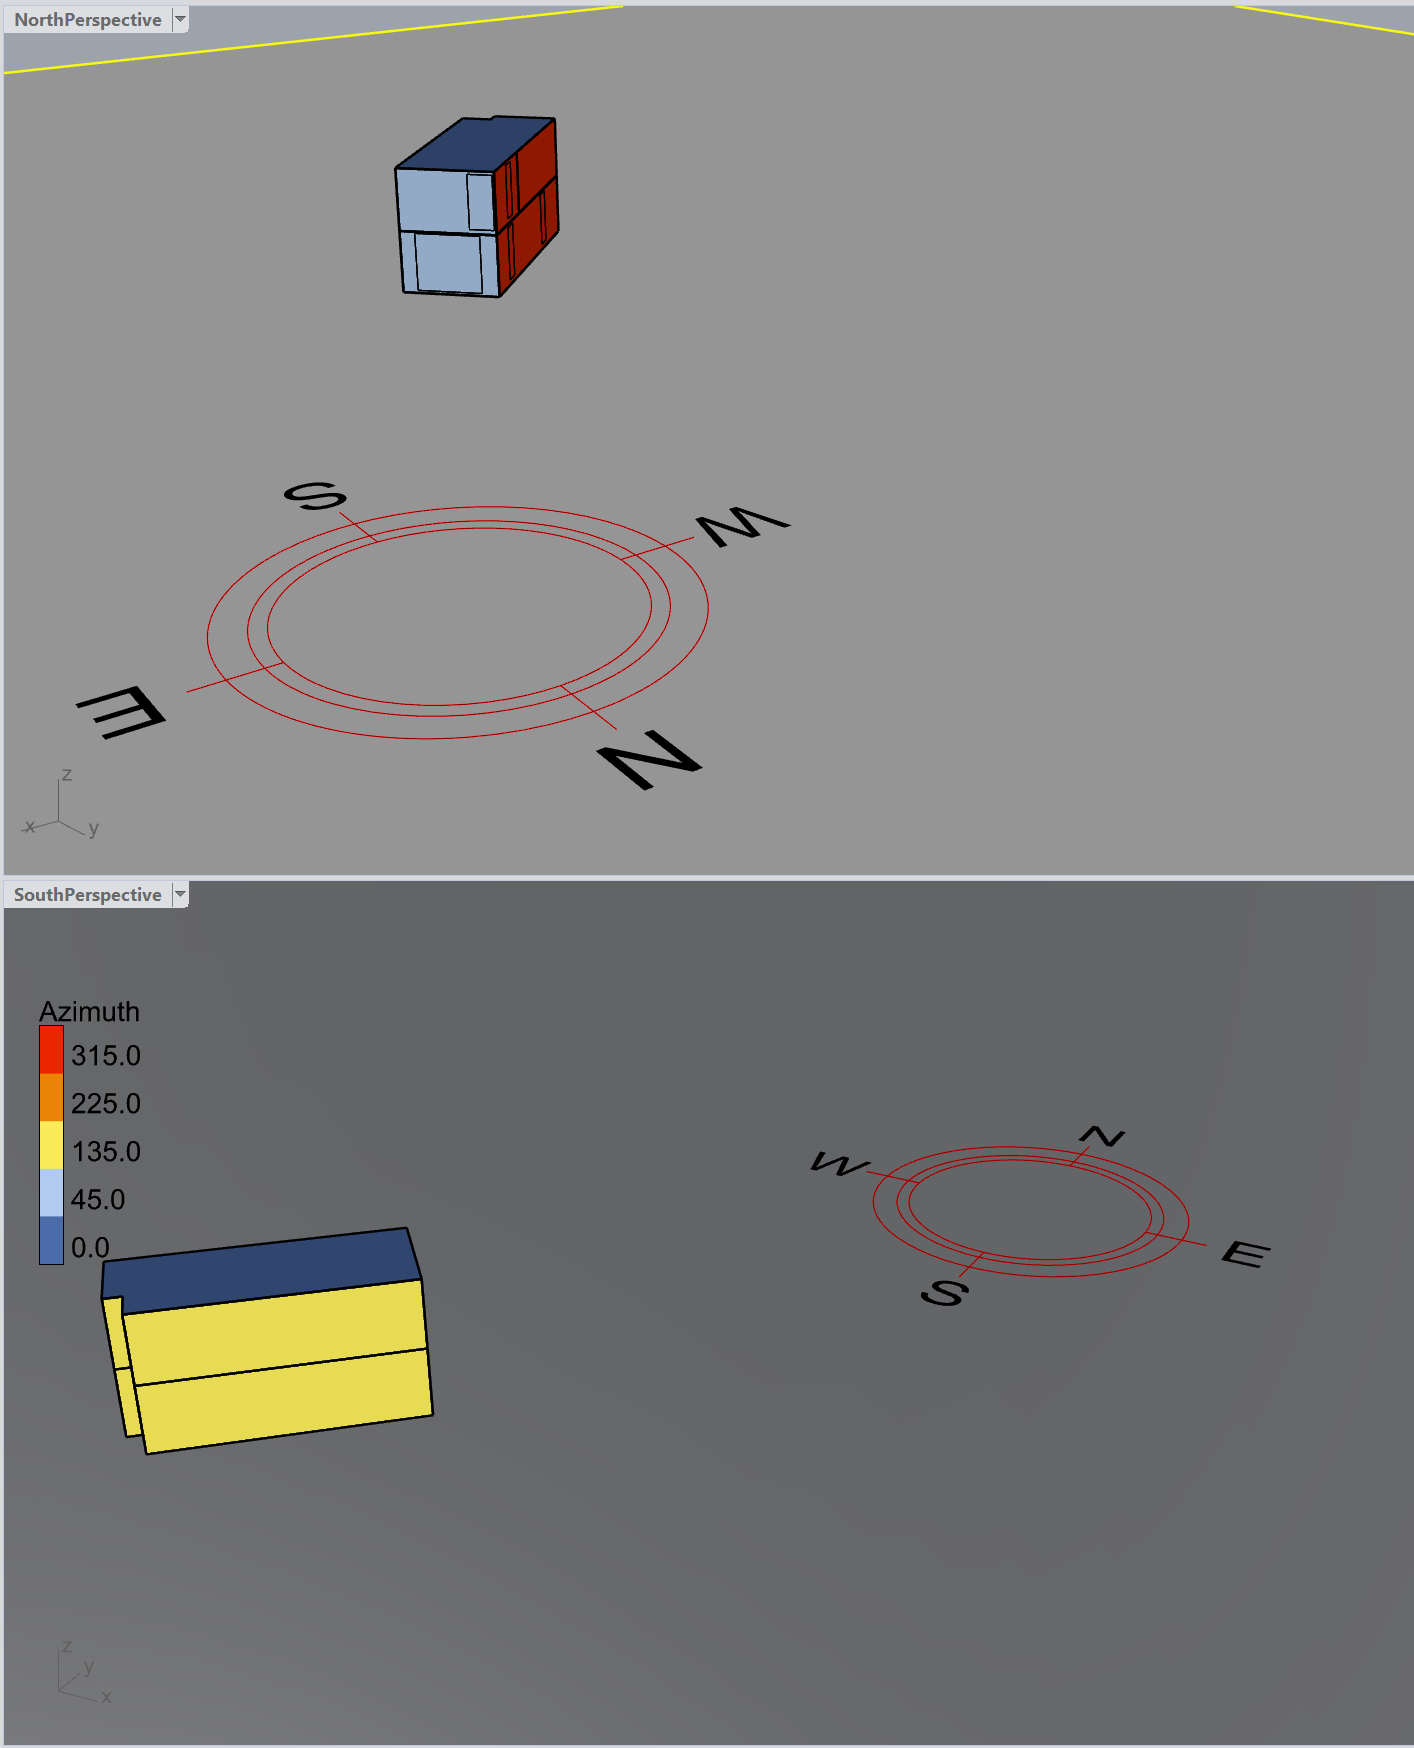
Your suggestion makes a lot of sense and I don’t know why I did not think of it in the first place. I just made a change to the LB Preview VisualizationSet component here:
Now, it exhibits the viewport_ behavior that you would expect.