Hello everyone,
I have created an example of generating an SVG image from a heatmap using Ladybug Tools and GRAPHIC+ tool. This example improves the efficiency of analyzing the output results and provides a better way to establish an automated workflow.
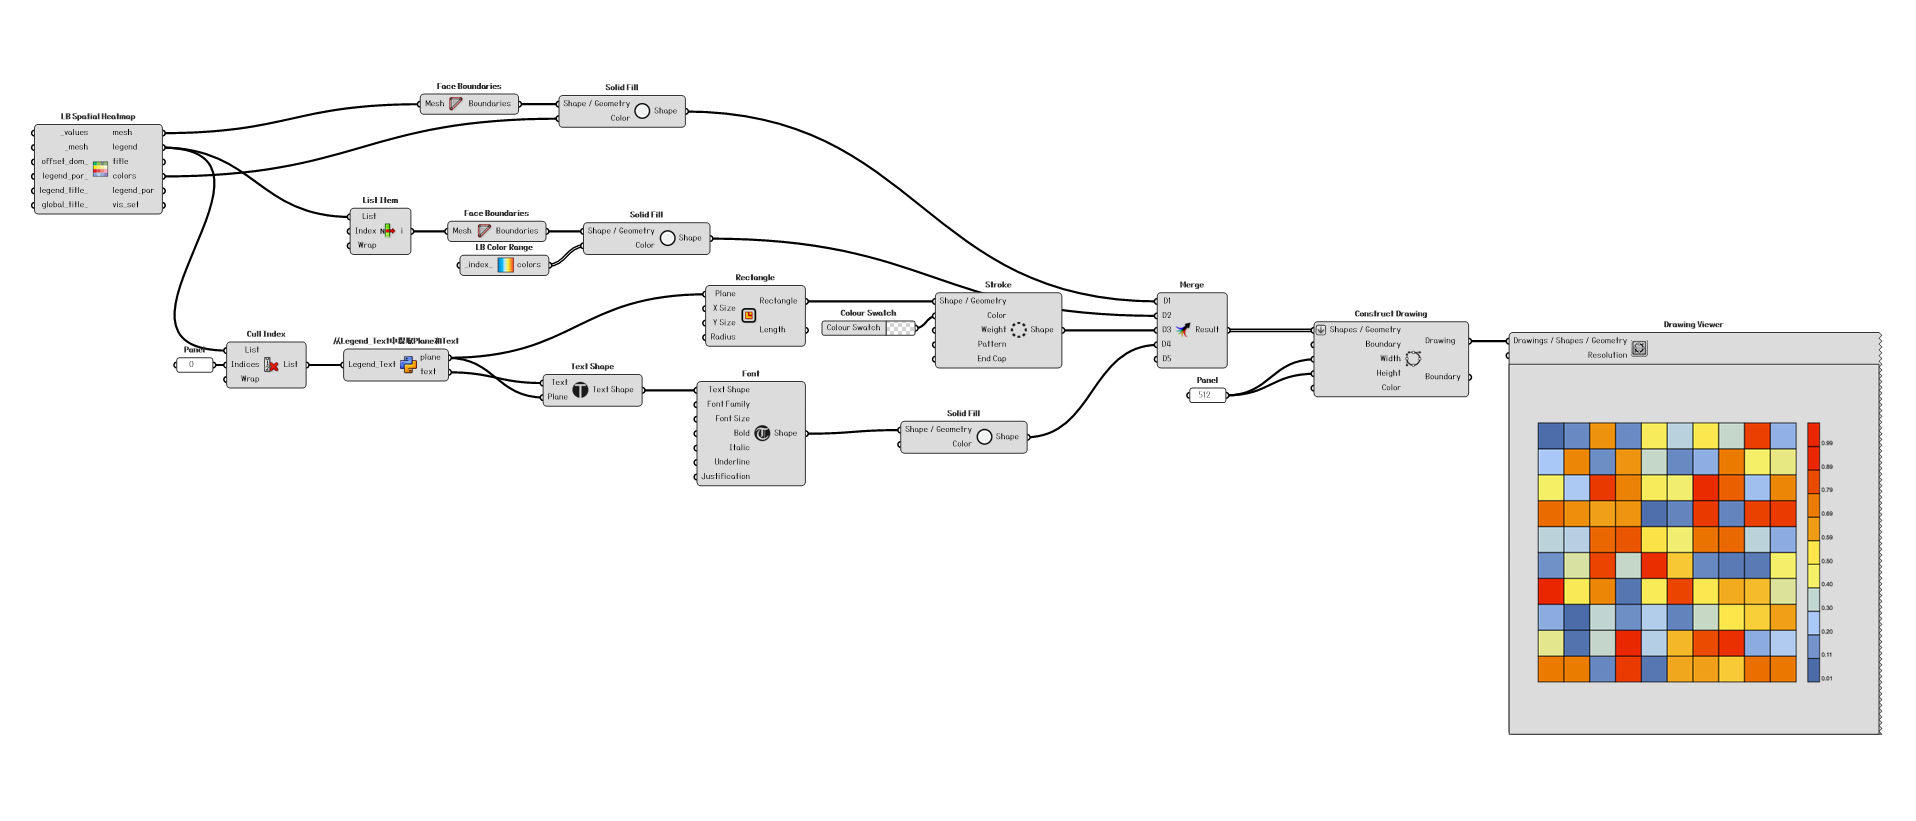
This is an SVG image.This image can be magnified to a high degree without losing any details or distorting the quality.

I have also created a small tool to extract text information and positions from the legend parameters.You can use the following code in GhPython to create this tool.
import Rhino.Geometry as rg

# Input parameters
text_goo = Legend_Text

try:
    # Try to extract plane and text
    plane = text_goo.m_value.TextPlane
    text = text_goo.m_value.Text

    # Output parameters
    plane_output = plane
    text_output = text
except AttributeError:
    # If AttributeError exception is raised (no m_value attribute), set output parameters to None
    plane_output = None
    text_output = None
This example is rough and based on my spontaneous inspiration. However, if Ladybug Tools can develop a small tool in the future that can accomplish this task more quickly and with lower resource consumption (as this process requires a large amount of memory), it would be even better. Alternatively, if someone is willing to share any new ways to improve this process, I can also try to create a small tool and share it with everyone.
Here is the relevant link for GRAPHIC+:
Graphic + | Food4Rhino
Welcome - Graphic Plus (gitbook.io)
This is the example I used:
Automatic output image.gh (24.8 KB)
Best
Zhengrong