I am using LBT 1.6 to calculate outdoor MRT and UTCI through honeybee. I am using Cairo International Airport Weather file (2007-2021), which can be found here: \climatewebsite\WMO_Region_1_Africa\EGY_Egypt
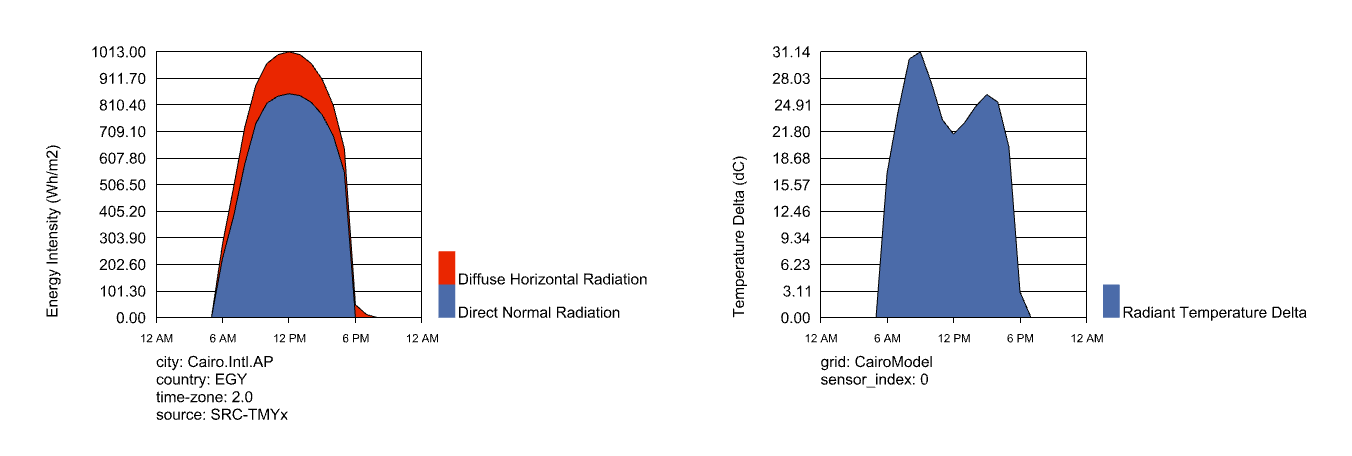
The MRT calculated from 7:00 to 17:00 does not follow the expected pattern. The shortwave MRT delta is very high at 8:00-9:00am and then decreases till 12 noon, before gradually increasing again till 2:00-3:00pm and then decreasing.
I wonder if anyone can explain why is the Shortwave MRT delta decreasing in the morning? and why is it the highest at 8-9am? I would expect it to increase gradually till 2-3pm before decreasing.
I also tried using different weather files for Cairo, same issue happens.
I will attach a grasshopper file with the model internalized. And the weather file used can be found in the link put here.
It seems that you forgot to include the EPW weather file, which is probably the most important thing here because the most likely explanation is that you are looking at a day with some scattered clouds. I know that Cairo is not the cloudiest climate but, if you want to run a study of a single day, make sure that you are importing the EPW file and looking at the direct and diffuse radiation for that day since those are directly related to the shortwave MRT delta.
Now I see what you mean. What you’re seeing here is not the result of the EPW file as I originally thought. You can see the comparison between the EPW radiation and shortwave MRT delta here:
Instead, what you are seeing here is predominantly the SolarCal model play out over the posture of a standing human subject. Because a standing human geometry has much more surface area exposed to the sun when the sun angle is low instead of high, you will typically find the peak shortwave MRT a couple of hours before or after noon (at least in summer months).
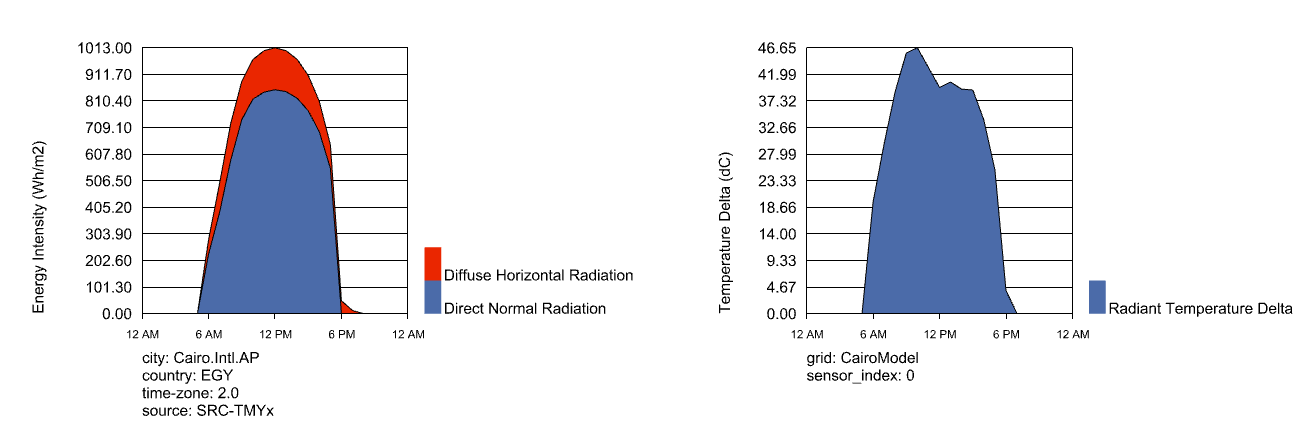
If you were to change the body posture to seated and fix the body azimuth at a particular value (eg. 180), you would see something closer to what you expect because a human subject that is seated has much more surface area exposed to direct sun when the sun is high compared to a subject that is standing. The other issue is that you selected a very dark pavement type (asphalt) and, when the sun is high, a significant fraction of the shortwave MRT delta that people experience is reflected off the ground. Making these two changes, the peak of MRT delta is a little closer to the peak of solar radiation in the EPW:
Bear in mind that the sky also has a temperature in the long wave part of the spectrum (dictated by the EPW’s horizontal_infrared_rad) and this should account for many of the the remaining differences between the grahpic above and what you’re expecting.
I hope that explains what is going on and, if you want more information on the SolarCal model and it’s assumptions, I would point you to this paper:
Thank you so much for taking the time to work on it and present the graphs.
I understand the issue now. The only problem is, I took real life measurements, including measurements of the Black Globe temperature, which showed a gradual increase from the morning till afternoon (Peak around 1-2pm), hence also it being the peak of the calculated MRT based on it.
Now, comparing those results to the simulation, they didn’t show a similar pattern, specifically because of the shortwave MRT delta. I will try to adjust the body posture and surface reflectivity to get it as close as it can be.
Please note that simulation of MRT also results in a much higher values compared to site measurements (differences up to 15 degree Celcius), especially in direct sunlight (those in shade are much closer).
Thanks for clarifying and I appreciate what you’re trying to do here. I know there are whole research papers devoted to reconciling the differences between the measurements of globe thermometers and the actual operative temperature humans experience (I remember the radius of the thermometer was an important criteria as well as the albedo). If you are really trying to match the results, I recommend playing around with the SolarCal model inputs that you can see on the LB Solar Body Parameters component. I imagine that matching the absorptivity and emissivity of the model to the properties of your globe thermometer is particularly important.