Hi,
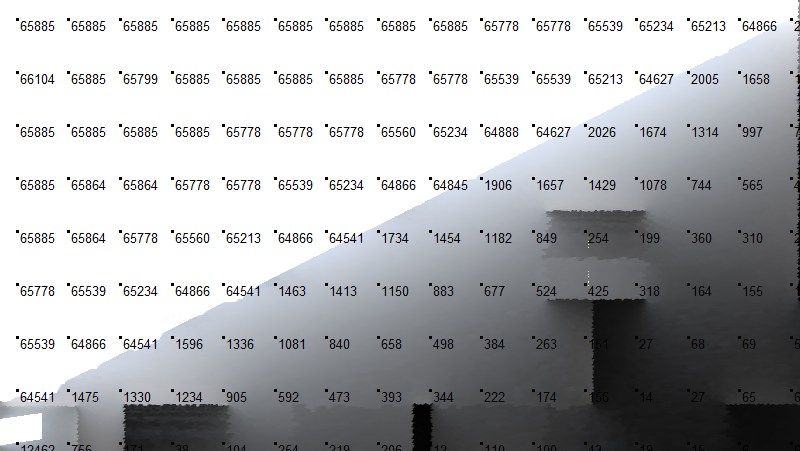
I would like to see the daylight analysis results on the test surface as a grid of values. Showing it as a colored mesh is nice, but sometimes I think seeing actual values would be more valuable. This is something it is very easy to do while using IES-VE, but with Honeybee and Grasshopper I didn’t find a way how to do it. I attached an image made with IES-VE as an example, where you can see illuminance values in Lux.
Thanks
Pretty easy @dstjelja,
From this hydra example i’ve just added a Tag component.
-A.
Honeybee_Grid-based_Daylight_Simulation_Example.gh (528.3 KB)
Thank you! 