There was one file put in the workshop sample files map I specifically like to know more: sample file 06_plus_solaraccess_gridbased.gh
Post Process Result Visualization/Cumulative results/Hourly Results
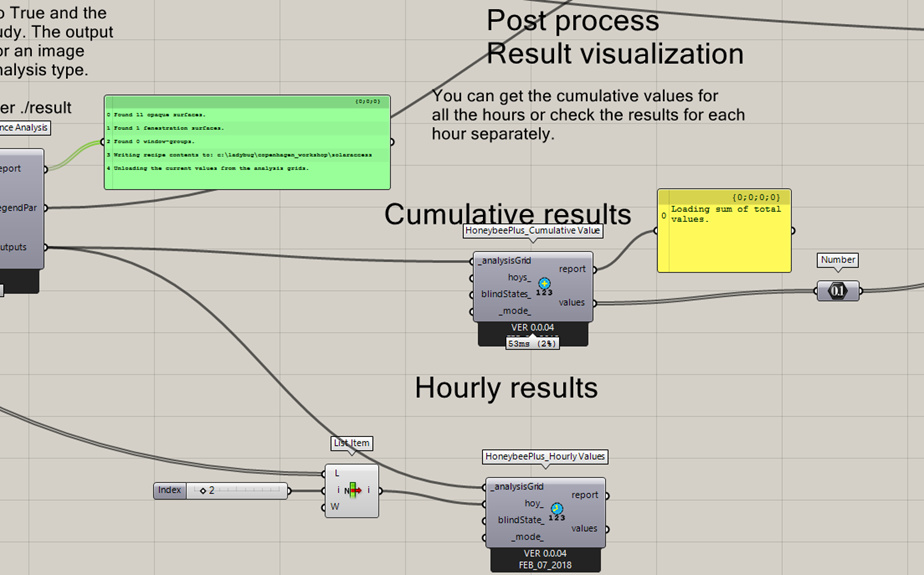
I see 2 ways to get the results. The cumulative way is clear to me, it is the total sum of sunhours.
The hourly results not really are clear. So you can scroll through a period and see when there is sun, how should I interpret it?
For the output of the values, you need always a component “Number”?