Yes. If it doesn’t work then it should be a bug. For now you can divide the results by timestep because otherwise Recipe will consider each sun vector as a separate hour. For every 5 minutes timestep should be set to 12.
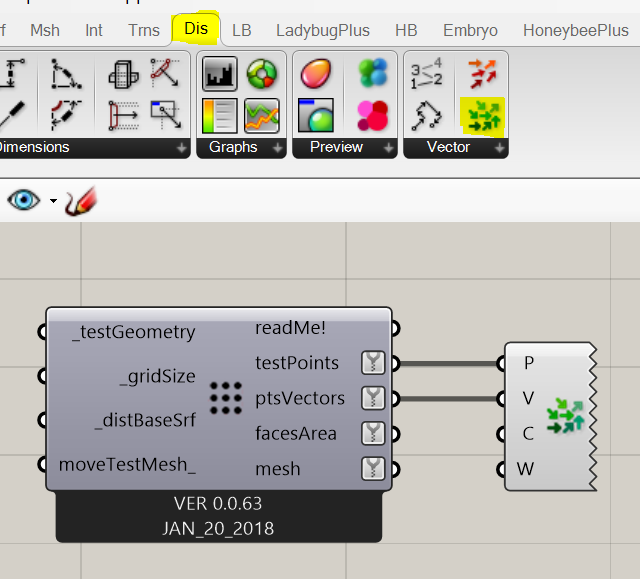
You can use Vector Display Component to visualize vectors. And yes use flip to flip the direction of the original surface.
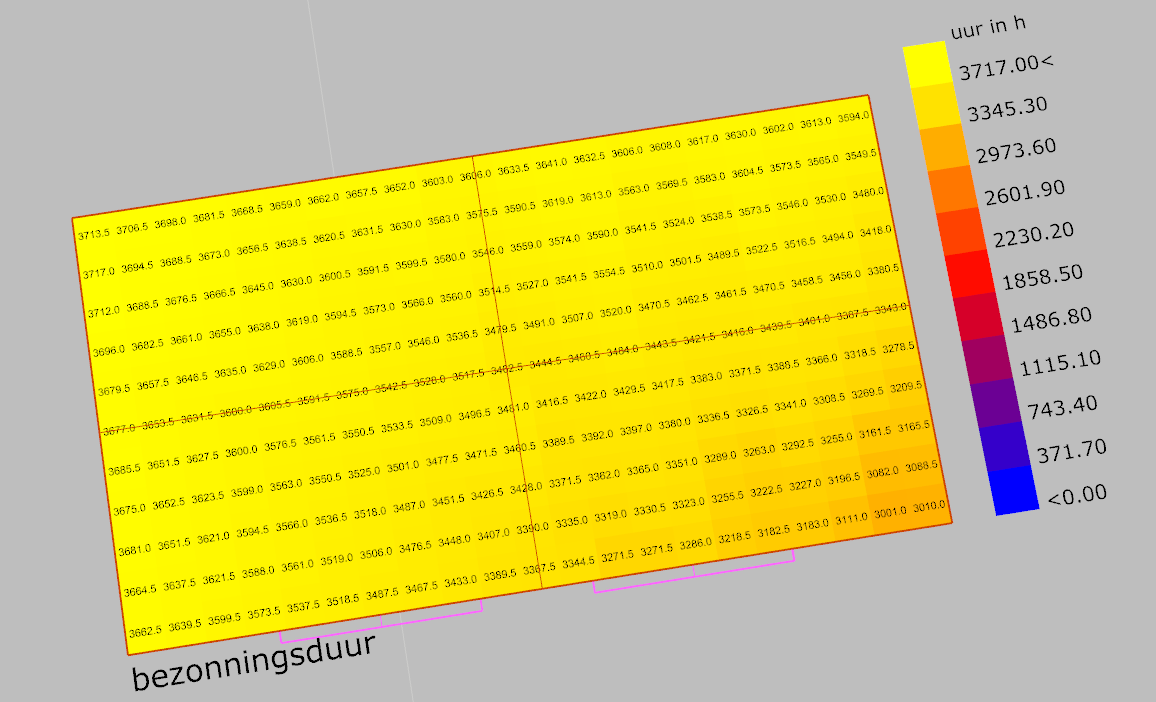
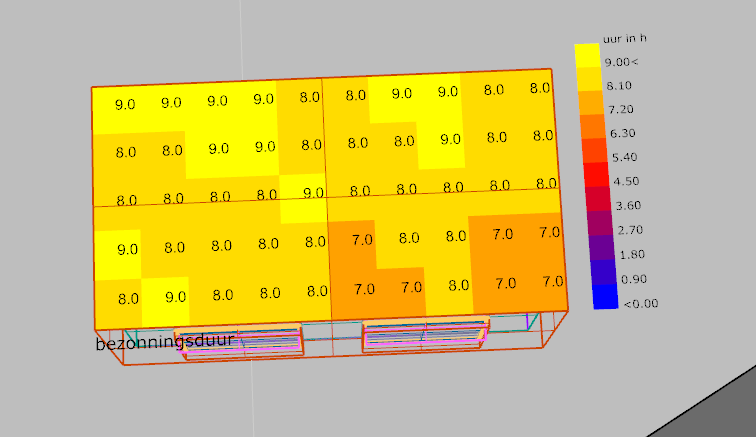
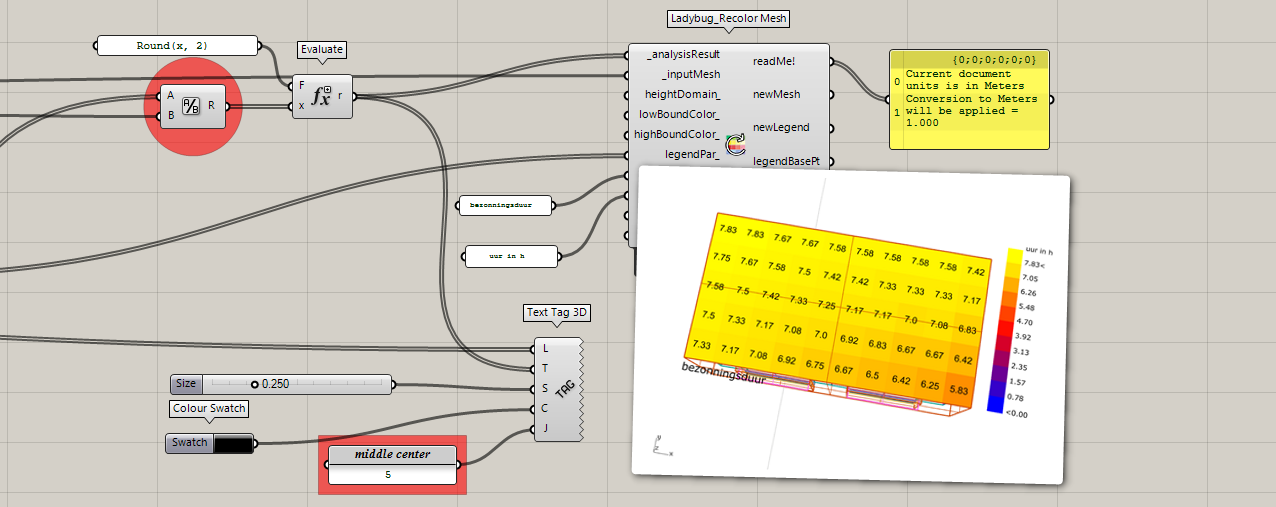
ok thanks. Next point is I set the timestep to 12. So this means a 5 minutes interval. The problem is now that the displayed grid values doesn’t correspont to the legend value and color. I think the legend value color is correct but the grid values are approximate values to whole hours (integers). How could I round the values to two decimal places? Thanks for any suggestions.
Finally, you can use numSegments input on Legend Parameters component to change the number of segments of legend to get the desired number to show up on the legend. See the changes in red.
okay I tried to calculate it for a period (for example from 19 february to 21 march. To understand for me what happened in steps:
In the LadybugPlus_Analysis Period component we create the vectors for the sunpath.
So per hour we create 12 sunvectors.
In the HoneybeePlus_Solar Access Pecipe component we have to define the vectors and hoys.
So de recipe understand when a vector meet the gridpoints. So each sun vector represents 1/12 hour.
De division component divides all the sunvectors of the period by the total number of values.
Run just fine in my machine. The same file @mostapha uploaded, just changing the data for the period.
Upload your file or a snapshot of how you define your analysis period.
-A.
@AbrahamYezioro Thanks! Aha after internalizing the brep components it works fine indeed. Sorry it’s the first time for me doing this.In the Ladybug Tools Forum Guidelines I saw only the example of internalizing with geo. So I was a bit confused.
So this is weird. It is supposed to work also without internalizing the geometry.
Just checked this case and it works fine. So something is happening at your end that maybe is worth to debug.
-A.
@AbrahamYezioro indeed the case is not about internalizing but it seems about the maximum vectors for the LadybugPlus_Analysis component:
I tested for Amsterdam: The sun is always above the horizon between 9 - 16 h. So the number of vectors correspondents with the number of hoys. I tested for different timesteps.
The LadybugPlus_Analysis component works fine in this period:
A) timestep (12) so each 5 minutes - 19 feb - 14 mar - 2039 vectors
B) timestep (4) so each 15 minutes - 19 feb - 29 apr - 2029 vectors
C) timestep (2) so each 30 minutes - 19 feb - 29 apr - 2029 vectors
D) timestep (1) so each 60 minutes - 19 feb - 31 oct - 2039 vectors
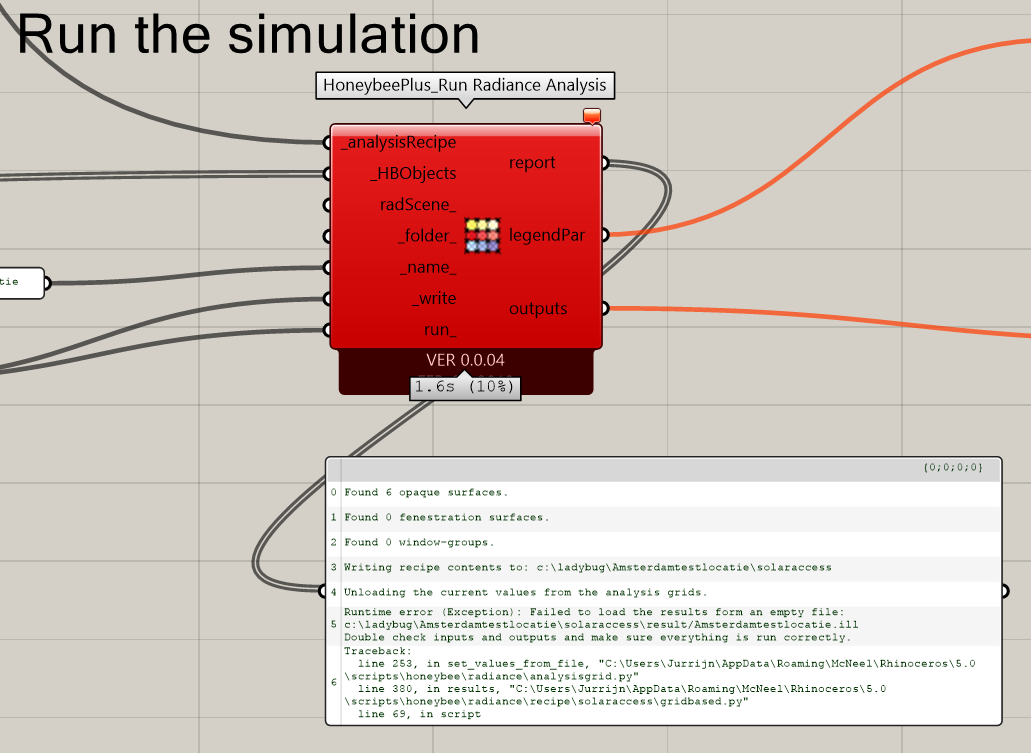
Setting the period one day or hour longer and I got the error. So I conclude there is a maximum of 2039 vectors. Is it possible to maximize this? @mostapha Thanks for any suggestions.
As you can see i set the whole range of hours for the whole period in YOUR file (same geometry, same EPW).
So the problem is because something else and i can’t reproduce it in my machine.
Another thing: I noticed you are using Rhino5. So i tested on both 5 and 6 and it works fine on both.
-A.
There is a limitation of 10,000 sun vectors at a time because of how the number is set in rcontrib in Radiance. Not sure if this is a technical limitation or is set to this number because of computing power limitations at the time. In any case it shouldn’t be a problem for your case with 2000 sun vectors.
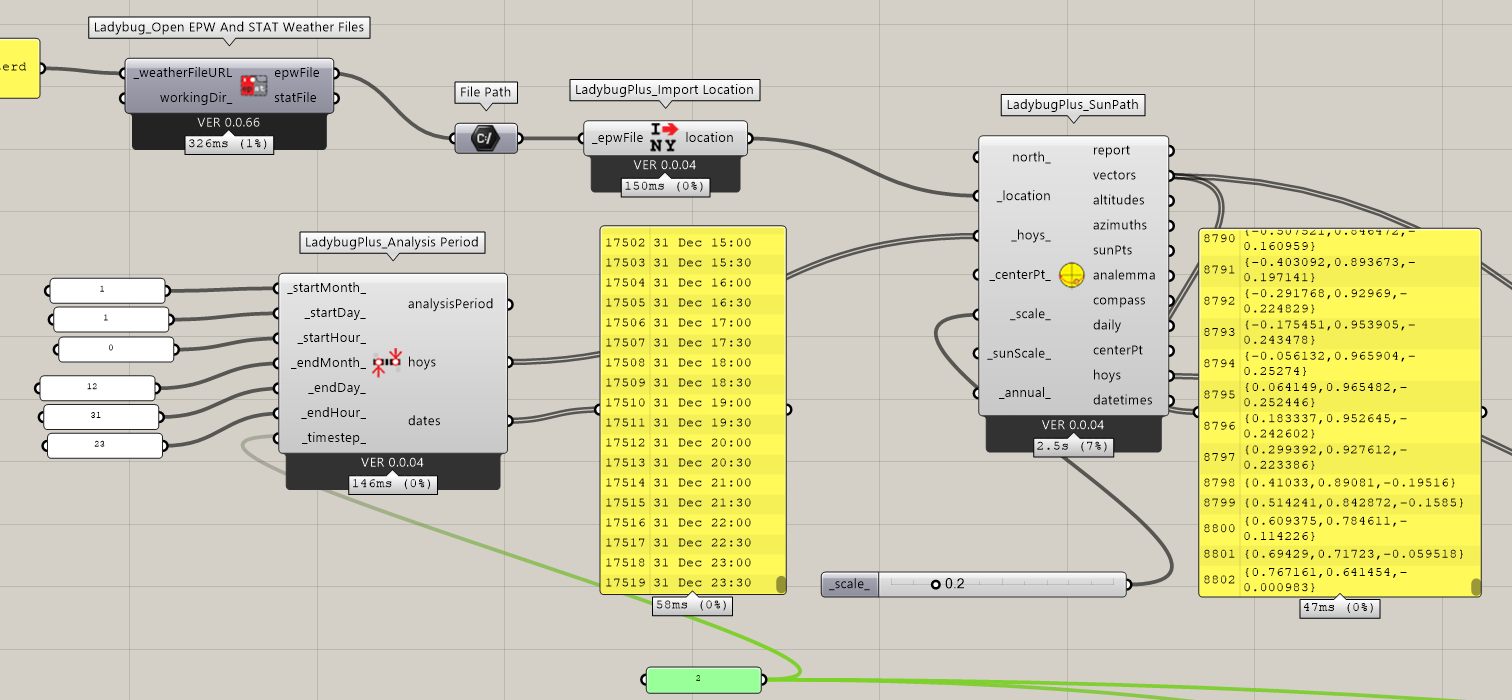
Thanks for the info @mostapha ! I installed Radiance 5.1 in stead of 5.0 or 5.22. See example below, then it works for a whole year with timestep 2 with 8802 vectors. My goal is hypothetical.doing this for an interval of 5 minutes for a year.

 ! I installed Radiance 5.1 in stead of 5.0 or 5.22. See example below, then it works for a whole year with timestep 2 with 8802 vectors. My goal is hypothetical.doing this for an interval of 5 minutes for a year.