I have been working on the comfort simulation and I used the MicroclimateMap module to visualize the comfort level in the zone. However, upon examing the output file, I noticed that on some occasions the PMV values are above 3.0 which exceed the PMV limit. I looked at the code but I could not figure out what went wrong. Here is the output file: https://drive.google.com/file/d/1FY1vMgJW7NC02L7WR8H5-Z-I0lKYYQrV/view?usp=sharing
I also have the PMVComfortCalculator module in my simulation and the results from that module make sense.
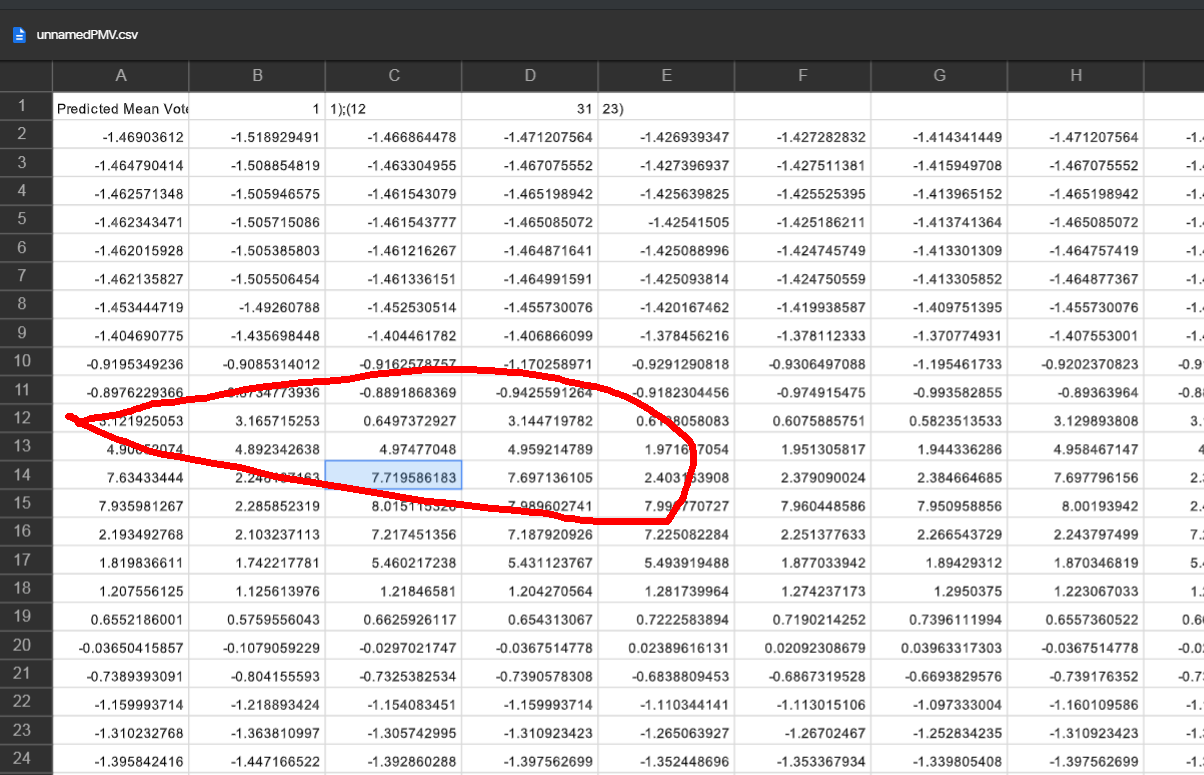
PMV values beyond the range of -3 to +3 are definitely possible outcomes from the PMV algorithm.
It seems that you get extremely high values of PMV there in your simulation because it is probably a location close to a window where the sun is beating down on the occupant, resulting in very high mean radiant temperature.
Of course, the original studies from which PMV is derived didn’t involve subjects that could vote for a value of 7 or subjects sitting in solar conditions like your model, which probably would have given them a really bad sun burn after an hour and would have caught the attention of ethics committees. So there is understandably a lot of difficulty in determining what exactly a PMV of 7 output from Fanger’s function actually means. One thing can be agreed upon, though, which is that it is clearly very uncomfortably hot and well beyond the acceptable limits of any indoor comfort standard. So, for the purpose of evaluating the acceptability of conditions, it shouldn’t matter whether it’s a value of +3 or a value of +7. Both are clearly not acceptable.